HDOJ 4456 Crowd 離散化+二維樹狀數組
將坐標旋轉45度就可以得到正方形,可以用二維樹狀數組求解...
為了節省內存,提前將樹狀數組中會被更新的點全都存下來,並離散化
Crowd
Time Limit: 5000/2000 MS (Java/Others) Memory Limit: 32768/32768 K (Java/Others)
Total Submission(s): 1199 Accepted Submission(s): 282
Problem Description City F in the southern China is preparing lanterns festival celebration along the streets to celebrate the festival.
Since frequent accidents had happened last year when the citizens went out to admire the colorful lanterns, City F is planning to develop a system to calculate the degree of congestion of the intersection of two streets.
The map of City F is organized in an N×N grid (N north-south streets and N west-east street). For each intersection of streets, we define a density value for the crowd on the intersection.
Initially, the density value of every intersection is zero. As time goes by, the density values may change frequently. A set of cameras with new graphical recognition technology can calculate the density value of the intersection easily in a short time.
But the administrator of the police office is planning to develop a system to calculate the degree of congestion. For some consideration, they come up with a conception called k-dimension congestion degree. The k-dimension congestion degree of intersection (x0,y0) is represented as c(x0,y0,k), and it can be calculated by the formula below:

Here, d(x,y) stands for the density value on intersection (x,y) and (x,y) must be in the N×N grid. The formula means that all the intersections in the range of manhattan distance k from (x0,y0) effect the k-dimension congestion degree of (x0,y0) equally, so we just simply sum them up to get the k-dimension congestion degree of (x0,y0).
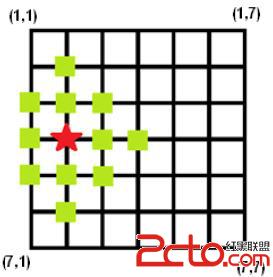
The figure below shows a 7×7 grid, and it shows that if you want to get the 2-dimension congestion degree of intersection (4,2),you should sum up the density values of all marked intersections.

Input These are multiple test cases.
Each test case begins with a line with two integers N, M, meaning that the city is an N×N grid and there will be M queries or events as time goes by. (1 ≤ N ≤10 000, 1 ≤ M ≤ 80 000) Then M lines follow. Each line indicates a query or an event which is given in form of (p, x, y, z), here p = 1 or 2, 1 ≤ x ≤ N, 1 ≤ y ≤ N.
The meaning of different p is shown below.
1. p = 1 the value of d(x,y) is increased by z, here -100 ≤ z ≤ 100.
2. p = 2 query the value of c(x,y,z), here 0 ≤ z ≤ 2N-1.
Input is terminated by N=0.
Output For each query, output the value for c(x,y,z) in a line.
Sample Input
8 5
1 8 8 1
1 1 1 -2
2 5 5 6
1 5 5 3
2 2 3 9
3 2
1 3 2 -9
2 3 2 0
0
Sample Output
1
1
-9
Source 2012 Asia Hangzhou Regional Contest
/* ***********************************************
Author :CKboss
Created Time :2015年08月31日 星期一 10時17分01秒
File Name :HDOJ4456.cpp
************************************************ */
#include
#include
#include
#include
#include
#include
#include
#include
#include
#include
#include

