最後設置兩個軸的屬性,Excel.XlAxisType.xlValue對應的是Y軸,Excel.XlAxisType.xlCategory對應的是X軸:
Excel.Axis valueAxis = (Excel.Axis)xlChart.Axes(Excel.XlAxisType.xlValue, XlAxisGroup.xlPrimary);
  valueAxis.AxisTitle.OrIEntation = -90;
  Excel.Axis categoryAxis = (Excel.Axis)xlChart.Axes(Excel.XlAxisType.xlCategory, XlAxisGroup.xlPrimary);
  categoryAxis.AxisTitle.Font.Name = "MS UI Gothic";
到此,一切就緒了,下面要生成Chart,並將其存為一個Excel文件:
try
{
  ThisApplication = new Excel.Application();
  m_objBooks = (Excel.Workbooks)ThisApplication.Workbooks;
  ThisWorkbook = (Excel._Workbook)(m_objBooks.Add(Type.Missing));
  ThisApplication.DisplayAlerts = false;
  this.DeleteSheet();
  this.AddDatasheet();
  this.LoadData();
  CreateChart();
  ThisWorkbook.SaveAs("z:\\Book2.xls", Type.Missing, Type.Missing,
          Type.Missing, Type.Missing, Type.Missing, Excel.XlSaveAsAccessMode.xlNoChange,
        Type.Missing, Type.Missing, Type.Missing, Type.Missing);
  }
catch (Exception ex)
{
  MessageBox.Show(ex.Message);
}
finally
{
  ThisWorkbook.Close(Type.Missing, Type.Missing, Type.Missing);
  ThisApplication.Workbooks.Close();
  ThisApplication.Quit();
      System.Runtime.InteropServices.Marshal.ReleaseComObject(ThisWorkbook);
        System.Runtime.InteropServices.Marshal.ReleaseComObject(ThisApplication);
  ThisWorkbook = null;
  ThisApplication = null;
  GC.Collect();
  this.Close();
}
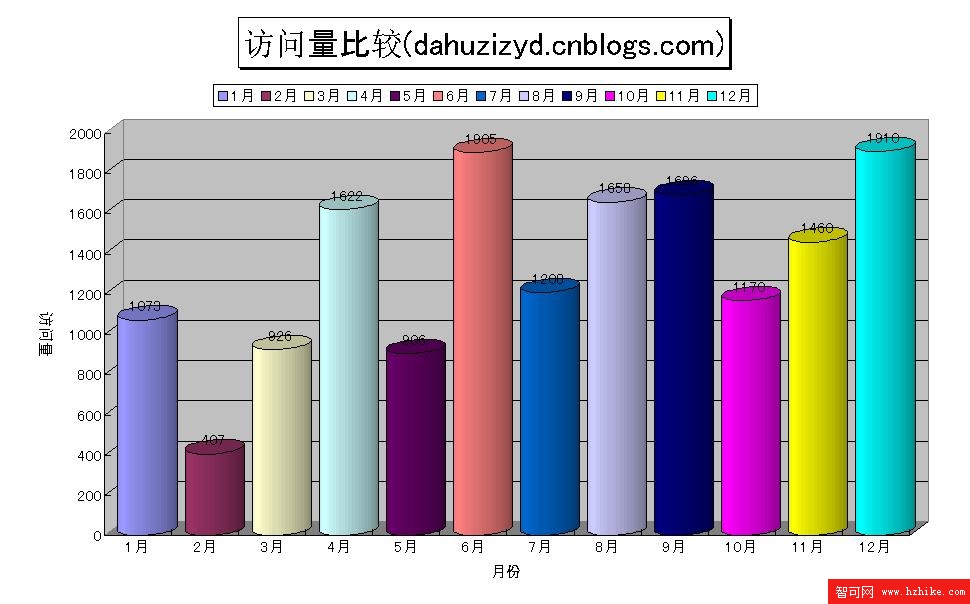
運行你的程序,打開生成的Excel文件,最終生成的Chart應該像這樣:
