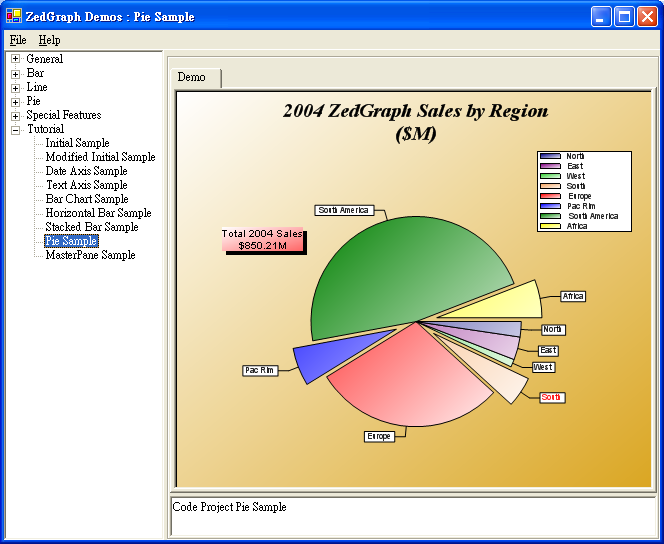
這節我把餅形圖粗略的介紹一下,如下圖。

using System;

using System.Drawing;

using System.Collections;

using ZedGraph;

namespace ZedGraph.Demo

{

     ///<summary>

     /// Summary description for SimpleDemo.

     ///</summary>

     public class PIESampleDemo : DemoBase

     {

           public PieSampleDemo() : base( "Code Project PIE Sample",

                                                 "Pie Sample", DemoType.PIE, DemoType.Tutorial )

           {

                GraphPane myPane = base.GraPHPane;

                // Set the GraPHPane title

                myPane.Title = "2004 ZedGraph Sales by Regionn($M)";

                myPane.FontSpec.IsItalic = true;

                myPane.FontSpec.Size = 24f;

                myPane.FontSpec.Family = "Times";

                // Fill the pane background with a color gradIEnt

                myPane.PaneFill = new Fill( Color.White, Color.Goldenrod, 45.0f );

                // No fill for the axis background

                myPane.AxisFill.Type = FillType.None;

                // Set the legend to an arbitrary location

                myPane.Legend.Position = LegendPos.Float ;

                myPane.Legend.Location = new Location( 0.95f, 0.15f, CoordType.PaneFraction,

                                           AlignH.Right, AlignV.Top );

                myPane.Legend.FontSpec.Size = 10f;

                myPane.Legend.IsHStack = false;

                // Add some pIE slices

                PieItem segment1 = myPane.AddPIESlice( 20, Color.Navy, Color.White, 45f, 0, "North" );

                PieItem segment3 = myPane.AddPIESlice( 30, Color.Purple, Color.White, 45f, .0, "East" );

                PieItem segment4 = myPane.AddPIESlice( 10.21, Color.LimeGreen, Color.White, 45f, 0, "West" );

                PieItem segment2 = myPane.AddPIESlice( 40, Color.SandyBrown, Color.White, 45f, 0.2, "South" );

                PieItem segment6 = myPane.AddPIESlice( 250, Color.Red, Color.White, 45f, 0, "Europe" );

                PieItem segment7 = myPane.AddPIESlice( 50, Color.Blue, Color.White, 45f, 0.2, "Pac Rim" );

                PieItem segment8 = myPane.AddPIESlice( 400, Color.Green, Color.White, 45f, 0, "South America" );

                PieItem segment9 = myPane.AddPIESlice( 50, Color.Yellow, Color.White, 45f, 0.2, "Africa" );

                segment2.LabelDetail.FontSpec.FontColor = Color.Red;

                // Sum up the pIE values

                CurveList curves = myPane.CurveList ;

                double total = 0 ;

                for ( int x = 0 ; x < curves.Count ; x++ )

                     total += ((PIEItem)curves[x]).Value ;

                // Make a text label to highlight the total value

                TextItem text = new TextItem( "Total 2004 Salesn" + "$" + total.ToString () + "M",

                                           0.18F, 0.40F, CoordType.PaneFraction );

                text.Location.AlignH = AlignH.Center;

                text.Location.AlignV = AlignV.Bottom;

                text.FontSpec.Border.IsVisible = false ;

                text.FontSpec.Fill = new Fill( Color.White, Color.FromArgb( 255, 100, 100 ), 45F );

                text.FontSpec.StringAlignment = StringAlignment.Center ;

                myPane.GraphItemList.Add( text );

                // Create a drop shadow for the total value text item

                TextItem text2 = new TextItem( text );

                text2.FontSpec.Fill = new Fill( Color.Black );

                text2.Location.X += 0.008f;

                text2.Location.Y += 0.01f;

                myPane.GraphItemList.Add( text2 );

                base.ZedGraphControl.AxisChange();

           }

     }

}