R軟件功能非常強大,可以很好的進行各類統計,並能輸出圖形。下面介紹一種R語言和C#進行通信的方法,並將R繪圖結果顯示到WinForm UI界面上。
1 前提准備
安裝R軟件,需要安裝32位的R軟件,64位的調用會報錯。另外就是講R添加到電腦環境變量中。
打開R軟件,安裝包 scatterplot3d,演示需要用到此R包。
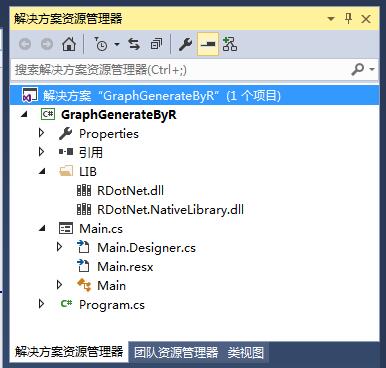
2 創建項目GraphGenerateByR,項目結構如下:

注意這裡需要引入RDotNet類庫,可以自行下載:http://rdotnet.codeplex.com/
3 Main窗體代碼
 1 using System;
 2 using System.Collections.Generic;
 3 using System.ComponentModel;
 4 using System.Data;
 5 using System.Drawing;
 6 using System.Linq;
 7 using System.Text;
 8 using System.Windows.Forms;
 9
10 namespace GraphGenerateByR
11 {
12     using RDotNet;
13     public partial class Main : Form
14     {
15         public Main()
16         {
17             InitializeComponent();
18         }
19         REngine engine = null;
20
21         string Rcode = "";
22         private void btnPlot_Click(object sender, EventArgs e)
23         {
24             try
25             {
26                 if(this.txtRcode.Text=="")
27                 {
28                     Rcode = @"library('scatterplot3d')
29                             z <- seq(-10, 10, 0.01)
30                             x <- cos(z)
31                             y <- sin(z)
32                             scatterplot3d(x, y, z, highlight.3d=TRUE, col.axis='blue', col.grid='lightblue',main='3d繪圖',pch=20)
33                            ";
34                 }
35                 else
36                 {
37                     Rcode = this.txtRcode.Text;
38                 }
39
40                 //R.3.2.4
41                 engine = REngine.GetInstance();
42                 engine.Initialize();
43                 //圖片加入GUID,防止重名(還有一種就是先刪除後保存)
44                 string rnd = System.Guid.NewGuid().ToString().Replace("-", "");
45                 string filename ="i"+ rnd+ "__Rimage.png";
46                 engine.Evaluate(string.Format("png(file='{0}',bg ='transparent',width={1},height={2})", filename, this.ptbGraphic.Width, this.ptbGraphic.Height));
47
48                 //engine.Evaluate(@"x <- (0:12) * pi / 12
49                 //                y <- cos(x)
50                 //                plot(x,y);
51                 //                ");
52                 engine.Evaluate(Rcode);
53                 engine.Evaluate("dev.off()");
54                 string path = System.IO.Path.GetFullPath(filename);
55
56                 Bitmap image = new Bitmap(path);
57                 ptbGraphic.Image = image;
58             }
59             catch(Exception ex)
60             {
61                 MessageBox.Show(ex.Message);
62             }
63
64         }
65
66         private void Main_FormClosing(object sender, FormClosingEventArgs e)
67         {
68             if(engine!=null)
69             {
70                 //clean up
71                 engine.Dispose();
72             }
73         }
74     }
75 }
4 運行:
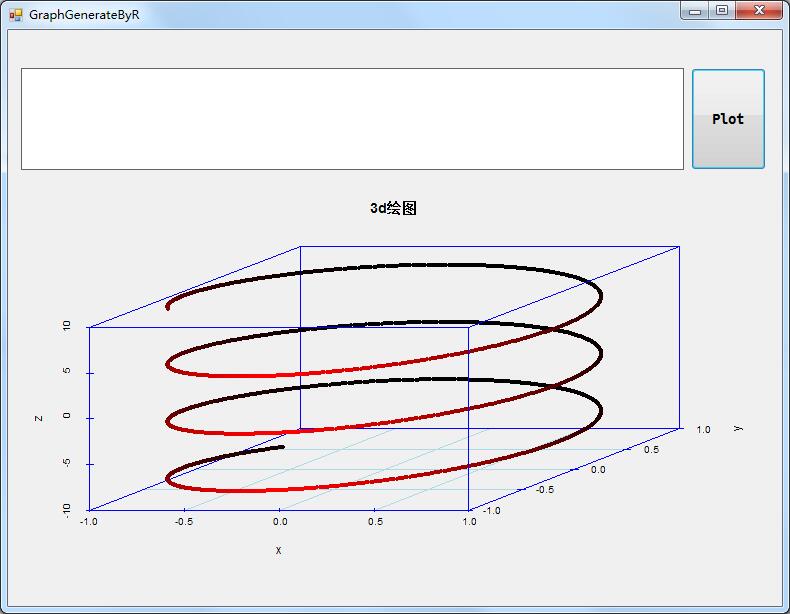
單擊plot後,調用默認R代碼,結構如下:

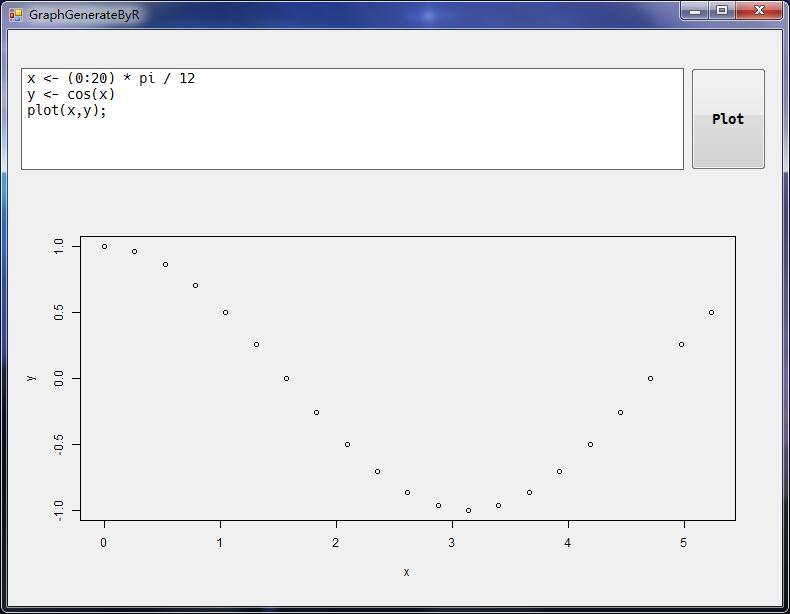
輸入合法的R繪圖語句,再次單擊Plot,結果如下:
