windows form chart控件功能已經非常強大了,做出來效果也是相當好看。更重要的是使用起來相當的方便。
現在要介紹的chart圖表的放大與縮小功能,當圖表要顯示的數據量很多的時候,這時就需要這個放大與縮小的功能了。
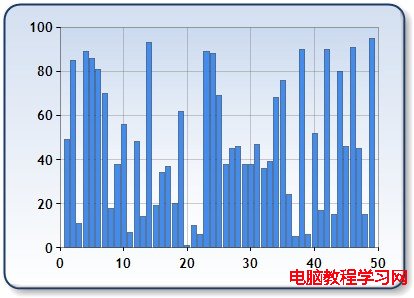
先上一個圖看效果:
當有幾百個數量並在一起時,能看到一個總體的趨勢。

圖1
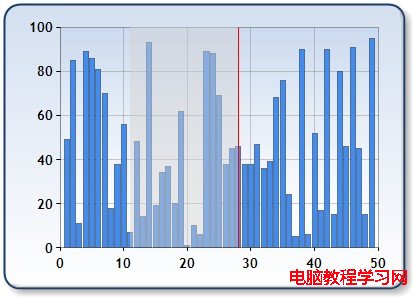
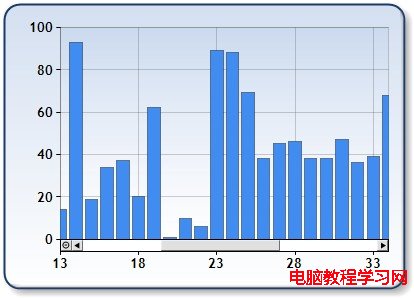
放大後的效果,可以看具體某一個值的大小了。

圖2

圖3
那麼現在就直接上代碼啦。
// Zoom into the X axis
chart1.ChartAreas[0].AxisX.ScaleView.Zoom(2, 3);
// Enable range selection and zooming end user interface
chart1.ChartAreas[0].CursorX.IsUserEnabled = true;
chart1.ChartAreas[0].CursorX.IsUserSelectionEnabled = true;
chart1.ChartAreas[0].AxisX.ScaleView.Zoomable = true;
//將滾動內嵌到坐標軸中
chart1.ChartAreas[0].AxisX.ScrollBar.IsPositionedInside = true;
// 設置滾動條的大小
chart1.ChartAreas["Default"].AxisX.ScrollBar.Size = 10;
// 設置滾動條的按鈕的風格,下面代碼是將所有滾動條上的按鈕都顯示出來
chart1.ChartAreas["Default"].AxisX.ScrollBar.ButtonStyle= ScrollBarButtonStyle.All;
// 設置自動放大與縮小的最小量
chart1.ChartAreas["Default"].AxisX.ScaleView.SmallScrollSize = double.NaN;
chart1.ChartAreas["Default"].AxisX.ScaleView.SmallScrollMinSize = 2;


