Debugging JavaScript in Visual Studio
from http://ASPalliance.com/1096_Debugging_JavaScript_in_Visual_Studio.2
Introduction: There is no denial of the fact that web applications are more scalable then its counterpart desktop application. If we call upon the past couple of decades and compare the present scenario from the standpoint of application software, undoubtedly web applications have gained popularity over 1);" href="http://ASPalliance.com/1096_Debugging_JavaScript_in_Visual_Studio.all#" target="_top">desktop applications. The architecture of a web application is different than that of desktop applications. Web pages typically are composed of some Html tags, images, scripting tags and JavaScript. Web pages interact with web servers with specific requests to execute web pages hosted on the web servers using browsers. There are various web servers that are in use these days. The most popular are
T: 400; FONT-SIZE: 10pt; COLOR: blue! important; FONT-FAMILY: Verdana; POSITION: relative">IIS, WebSphere, Weblogic, apache, etc. Web servers are installed with script engines. Such scripting engines are basically collections of librarIEs (dlls). When a page is requested from a browser the web server does not convert html tags, but interprets and parses all server tags and returns Html as an output back to the browser.
Web pages have become more and more interactive these days and often collect some input from the user and send that input to the server for interpretation. Increasingly, it is the onus of the developer to validate each and every such input on a web page. Validation of web pages has become sine-qua-non. If the developer does not validate inputs, the request becomes erroneous and the web application might throw an exception or even crash at some point. In order to ensure the inputs are validated before submitting the same to server, client side validation is required. There are some popular scripts that are used for clIEnt side validation.
This kind of technology is in the transition of creating its potential presence. It is not AJax (Asynchronous Java and XML). I had an occasion to make some spade work in AJAX and I came up with one sample application. It is really great and different too. In AJax there is no escape from using less JavaScript. The developer had to shift most of the logic required for the web form and write Javascript as a consequence of which the script size in terms of line numbers increases and so also become arduous to debug and fix errors. Microsoft’s Visual Studio IDE lets developers write code with ease. The debugging has become quite simple and easy which was not possible in traditional ASP application. In spite of the latest and new features in VS IDE, some of us find it cumbersome to debug JavaScript. But now you can stretch your legs and unfold you arms for debugging with JavaScript. There is a way out to debug Javascript too. A question might be whirling in your mind as to how to do that. Here are the some useful tips to debug JavaScript in ASP.Net.
Steps to be followed to debug JavaScript on ASP.Net: In this article I have used IIS and Visual Studio 2005.
Configurations:Step 1:
left" align="left" pb8q6="0" rurh8="0">Open an existing ASP.Net application in Visual Studio 2003/05 if there is any, which uses JavaScript or create a new demo application from scratch.
Step 2:
When we create a web project in Microsoft’s Visual Studio a file in the name of web.config is created by default in the web project.
We need to check the following setting:
<compilation debug="false" strict="false" explicit="rurh8="0">true" />
Then change the debug setting to “true” as in the following.
<compilation debug="true" strict="false" explicit="true" />
Step 3:
Open Internet Information Service (IIS). Here is how to open IIS.
Start à Settings à Control Panel à Administrative Tools à Internet Information Services
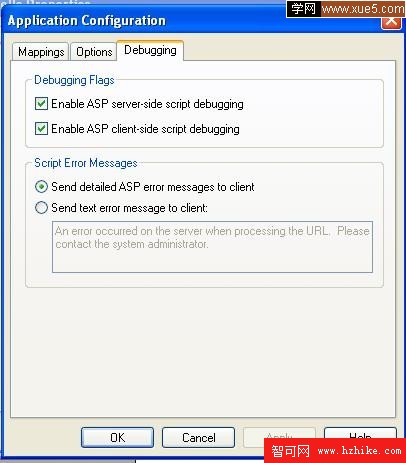
à Expand Web Sites à Default Web Site à right click on your web project you want to debug and click properties à click Directory Tab à click configuration à in the new opened window click Tab Debugging and if two check boxes labeled “Enable Server Side Script Debugging” and “Enable ClIEnt Side Script Debugging” are unchecked then check those two check boxes. (Pl refer to Screen Shot 1)
Figure 1

Step 4:
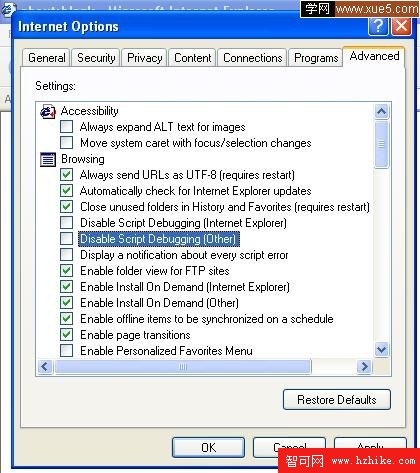
Open the Internet Explorer browser, click on menu Tools à Internet Options à Advanced Tab à if Disable Script Debugging (Internet Explorer) and Disable Script Debugging (Other) check boxes are checked then uncheck those two check boxes and click button OK. (Refer Screen Shot 2)
Figure 2

Step 5:
Now, open your web project in Visual Studio IDE. Select menu Tools.
If you open the project in VS 2003 then under Tools menu select attach a process and select ASPnet process and attach the process to the application.
If you open the project in VS 2005 then it does not require you to explicitly attach the ASPnet process. In the JavaScript add a break point where you want to debug and also add a break point in the .vb or .cs code file where the JavaScript function is called.
注意:Javascript一定要放到一個單獨的.JS文件裡,而不能直接在.ASPx頁裡寫JavaScript。然後像對待.cs或.vb文件一樣,在.JS文件裡給某行添加斷點即可。 Run the project by clicking on icon Start. The application will start and wait at the break point where you placed the break point. Conclusion Download Sample Isn’t it pretty simple to debug JavaScript?! Author - Rajendra Kumar Sahu www.mindfiresolutions.com
Step 6: