
 ·史上最便宜的主機空間 ·服務器租用托管首選品牌


t''s finally here - the launch of the .Net Reference Source project. This post (hopefully!) contains everything you need to know. Over the past few weeks, we ran a pilot of this feature and collected lots of great data that helped us work through some issues and understand where people were likely to have problems.
First, though, if you have any problems, please make sure you''ve followed all of the steps exactly as described. If you''re still having problems, please check the FAQ/Troubleshooting section at the bottom. If that doesn''t work, post a comment below and I''ll look into it.
Note this functionality is not available on the Express versions of the Visual Studio 2008 products.
1) Install the Visual Studio 2008 QFE. This Hotfix just updates a DLL that''s part of the Visual Studio debugger that fetches the source files, more details on the download page.
UPDATE: If you get an error installing the Hotfix , try inserting your VS 2008 DVD and then running the Hotfix EXE again. We''re looking into the root cause - it''s related to having a prior version of VS 2008 (e.g. Beta 2) installed on the Machine. But this workaround should allow the Hotfix to install properly.
UPDATE (1/18): There were some problems with the QFE link above that have been addressed, sorry for the inconvenIEnce, it''s fixed now.
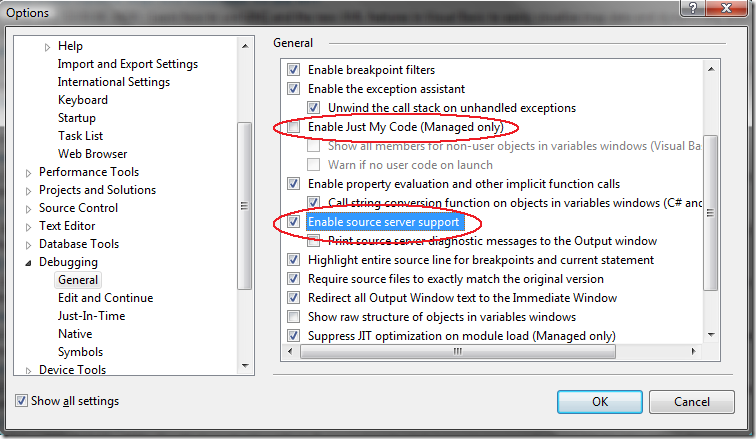
2) Start Visual Studio 2008 and bring up Tools > Options > Debugging > General. If you are running under the Visual Basic Profile, you will need to check the box on the lower left of the Options Dialog marked "Show All Settings" before continuing (other profiles won''t have this option).
Set the following two settings:
Your settings should be as below:
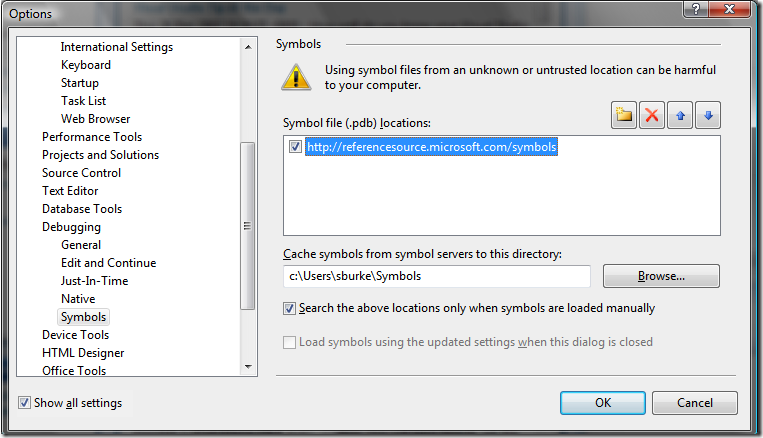
3) Next, bring up the "Symbols" Page and set the symbols download URL and a cache location. Specifically, set the three settings below:
When you''re finished, the settings should look like the image below:
Setup is done! That''s it, really!
For this simple example, we''ll start with a blank C# Windows Application project, but it will work the same with a VB, Web, or WPF project. To walk through this, go ahead and create that project.
Set a breakpoint in Form_Load:

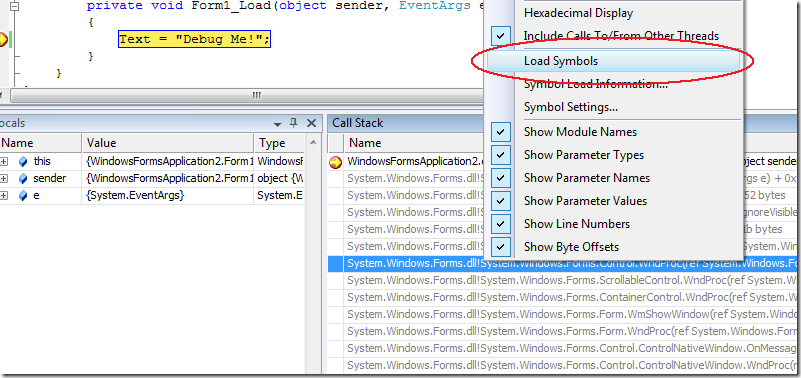
Now run your project to hit that breakpoint and go to your Call Stack window (CTRL+ALT+C). In the Call Stack, right click a frame that starts with System.Windows.Forms.dll, and choose "Load Symbols". This will load the symbols for the System.Windows.Forms assembly, which are about 10 megabytes, so the speed of the download will vary according to your connection speed. Note that Visual Studio may be unresponsive during this time. However, this download is a one-time cost for each assembly. The symbols (PDB) file will be cached on your Machine, in the directory specifIEd in the steps above.
 歡迎光臨學網,收藏本篇文章 [1] [2] [3] [4] [5] [6] [7] [8] [9] [10] [11] [12] [13]
This will load the symbols for the DLL from the server, and you''ll see some information in the status bar to reflect this. Note that when this completes, the call frames will turn black and line numbers will be available. Note you''ll need to do the Right Click -> Load Symbols step each time you launch a debugging session (but, again, the symbols will now be cached locally so they won''t have to download). For more information on this, see the ADVANCED USERS section below.

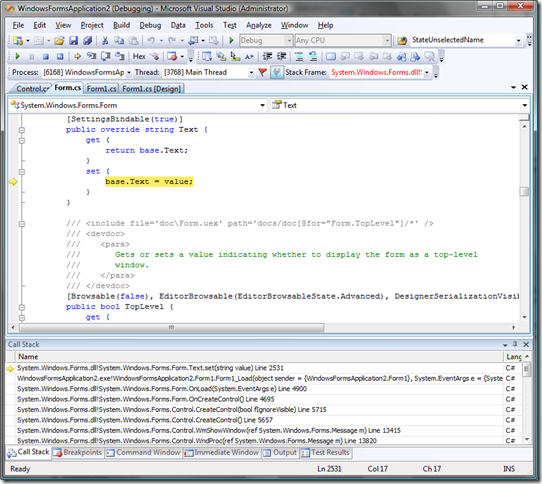
You have now loaded the symbols for the Windows Forms DLL and can begin viewing the code. You can vIEw code in any way that you normally would in a debugging session. In this case you can either Step In to the line of code above, or you can double-click one of the frames in the Call Stack Window. For this case, we''ll step in (F11).
The first time you step into code, we''ll be presented with the EULA for Accessing the source code. Please take the time to read this EULA. If you agree to the terms of the EULA, hit ACCEPT, and the source will then be downloaded.
That''s it! You''re now debugging .Net Framework Source!
 歡迎光臨學網,收藏本篇文章 [1] [2] [3] [4] [5] [6] [7] [8] [9] [10] [11] [12] [13]
Now, for each assembly that you''d like to debug into just repeat the steps above (note you''ll only see the EULA once, not for each file).
There are times when the Assembly you''d like to debug into isn''t on the call stack, for example in the code below:

Before you step in to Graphics.DrawRectangle, you need to get the symbols for System.Drawing.Dll loaded. To do this, we use the Modules Window (CTRL+ALT+U). This lists all of the modules (DLLs) loaded by the debuggee. Just find System.Drawing.DLL in this list, right click, and choose Load Symbols.
 歡迎光臨學網,收藏本篇文章 [1] [2] [3] [4] [5] [6] [7] [8] [9] [10] [11] [12] [13]
Note that once a symbol file is loaded, the path to the symbol file shows up in the "Symbol File" column.
You can now step into the Graphics.DrawRectangle code above using F11! In this case, note, you''ll have to step through the PaintEventArgs.Graphics property code first.
Normally, each time you launch a debugging session, Visual Studio attempt to download symbols for each DLL that loads into the debuggee process. As part of this process, it asks each path specified in the Debugging Symbols dialog for the corresponding PDB. Some projects load a LOT of DLLs which won''t have symbols available, so this process can significantly impact debugger startup time as this probing occurs. It is mainly for this reason we''ve recommended manual symbol loading in the steps above; we don''t want using this feature to degrade the debugging experIEnce across-the-board.
There is, however, a way to allow automatic symbol loading (which avoids the "Load Symbols" step) in a way that minimizes performance impact. This is for more advanced users because it requires regular trips back to this Debugging Symbols Dialog. Note you can quickly get to this dialog by choosing the "Symbol Settings..." item on the right click menus pictured in steps above form the Call Stack or Modules Windows.
The key is to get all of the symbols for a given project type downloaded and cached locally, then turn off the automatic symbol downloads. This will prevent the pings at debugger startup as well.
To do this, configure your setup as above with the following difference: Uncheck the "Search from the above locations..." item on the dialog.
Now, launch your project in the debugger. This will cause all of the symbols available for the DLLs in your process to be downloaded at on-demand as the DLLs are loaded into the process. Depending on your connection speed, this could take a while (it''s generally about 50MB of symbols), so it''s a good idea to hit F5 then go do something else for a while. Again,歡迎光臨學網,收藏本篇文章 [1] [2] [3] [4] [5] [6] [7] [8] [9] [10] [11] [12] [13]
these symbols are cached so this is a one-time cost. Visual Studio will likely be unresponsive during this download process.
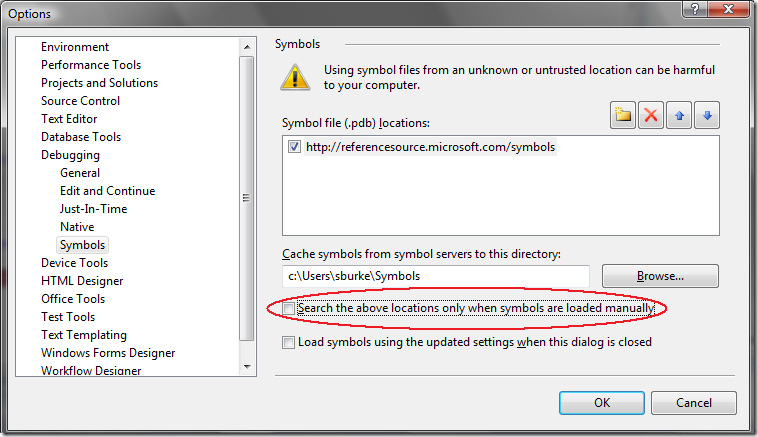
Once that process has completed, stop the debugger, and UNCHECK the the Reference Source Server symbol location, and hit OK:
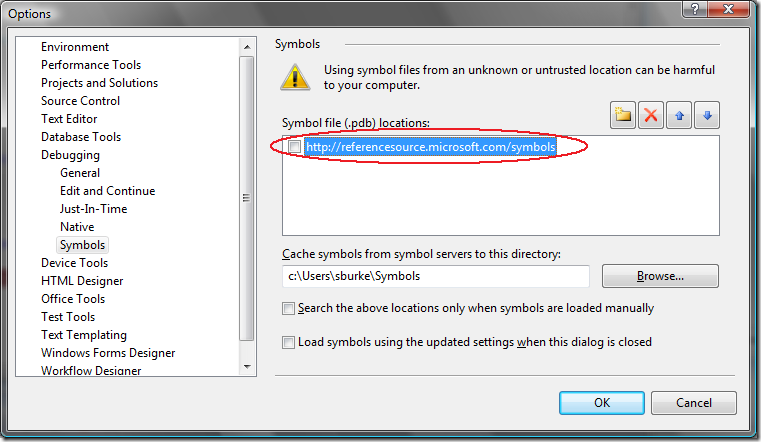
Now when you launch the debugger, symbols will load automatically and you''ll be be able to step in and through call stacks normally. Note if you switch to a different project type (that has different assemblies), or have assemblies that are loaded later by yourproject, you can just repeat these steps to get any assemblIEs you don''t have cached locally).
歡迎光臨學網,點擊這裡查看更多文章教程 [1] [2] [3] [4] [5] [6] [7] [8] [9] [10] [11] [12] [13]
This can be caused by one of four situations:

文章整理:學網 http://www.xue5.com (本站) [1] [2] [3] [4] [5] [6] [7] [8] [9] [10] [11] [12] [13]
First, see FAQ item (2) above to ensure the symbols for the DLL were loaded successfully. You can verify this by looking in the Modules Window under the "Symbols Status" column.
If the Symbols Status is "Symbols loaded.", check the following.
Microsoft Symbol Server provides symbols without any source information in them. That information has been removed (sometimes referred to as "stripped") before publishing. The symbols provided on the Reference Source Server are full symbols with debugging information.
The key to using both is to have your Reference Source path above the Symbol Server Path so that those symbols are searched/found first. As described in the ADVANCED USERS section above, you''ll likely want to launch your debugger once with this configuration to get all the symbols downloaded,歡迎光臨學網,點擊這裡查看更多文章教程 [1] [2] [3] [4] [5] [6] [7] [8] [9] [10] [11] [12] [13]
then uncheck both of these paths to avoid debugging launch slowdowns in the future. Also note that this may conflict in the future as more DLLs are added to the Reference Source Project. Meaning, if you''ve already downloaded the Symbol Server symbol, you''ll need to delete that or change your cache path to get the Reference Source one (Visual Studio has no way of knowing which is which).
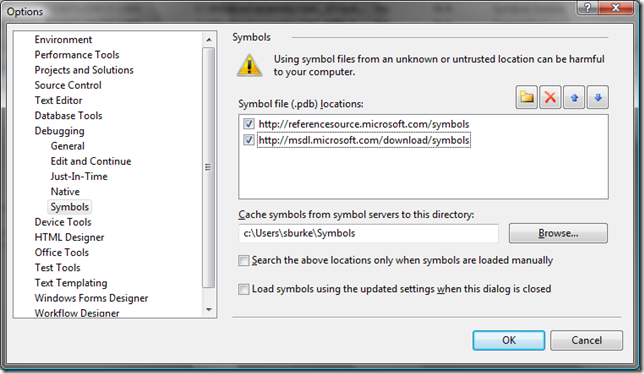
One final note here, if you have the Microsoft Symbol Server configured via _NT_SYMBOL_PATH, you''ll need to add the Reference Source path above to that path as well - _NT_SYMBOL_PATH overrides the above settings.
Yes, we''ve also provided 64-bit versions of the PDBs. Note some DLLs work on multiple architectures, so not all of them need a separate 64-bit PDB.
Visual Studio requires the code to exactly match what is expected by the PDB. The source publishing process, however, makes some small updates to the code, such as pushing a standard copyright banner to the end of the source file. This changes the signature (CRC) of the code file. However, it''s still easy to set a breakpoint.
Just set your breakpoint as normal (you''ll see it fails with a little warning icon), then right click the breakpoint and choose "Location..."
文章整理:學網 http://www.xue5.com (本站) [1] [2] [3] [4] [5] [6] [7] [8] [9] [10] [11] [12] [13]
.NetFrameworkSourceCode_9B9C/image_34.png">
Then check the "Allow Source to be Different" box, hit OK.
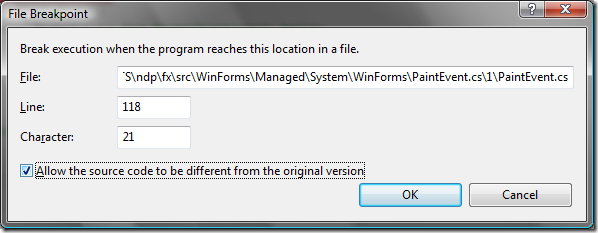
Now the breakpoint will set successfully.
If you find yourself doing this often, you can also disable source matching in general by disabling Tools->Options->Debugging: “Require source files to exactly match the original version.”
Browse database information is separate from symbol (PDB) information within the debugger, so that information is maintained by the project system when a project is compiled and is not present within the symbol files. So, unfortunately, that ability is not available here.
歡迎光臨學網,點擊這裡查看更多文章教程 [1] [2] [3] [4] [5] [6] [7] [8] [9] [10] [11] [12] [13]
The .Net Framework bits that you have installed on your Machine are “retail” bits, which means they are optimized for size and performance. Part of this optimization process removes certain information from the process when it is no longer needed. Debugging retail assemblies reflects this. However, most debugging information is still present in the session, and setting breakpoints earlIEr in a function often allows it to be visible. Another ASPect of retail builds is that some small methods may be “inlined” which means you will not be able to step into them or set breakpoints in them. But for the most part you can step and debug as normal.
Some source files are very large - nearly 1MB - and unfortunately many of these are the common ones to download. However, most are significantly smaller and download quickly. Source files must be downloaded each time you restart Visual Studio. They are not persistently cached like symbols are.
Not currently, but we are currently working on enabling this functionality in the future.
Not really - we do run a post processing step when publishing the code and it adds a standard copyright banner at the bottom. The processor, at this time, isn''t able to support multiple comment formats. Having it in a non-VB format doesn''t affect the debugging functionality in any way.
This is something we''ve seen intermittently but have not been able to diagnose. If you see this, usually the workaround is to just restart VS, which will force the file to reload. If you observe this behavior, please use the "Email" link on the left to email me the name of the file that failed and about what time the failure occurred.
歡迎光臨學網,點擊這裡查看更多文章教程 [1] [2] [3] [4] [5] [6] [7] [8] [9] [10] [11] [12] [13]
We''ve built a system that allows us to publish any number of versions of source and symbols for a given product. We haven''t made any firm decisions on how often we''ll publish source and are open to customer feedback on those issues. For example, it''s clear that publishing source for each Service Pack makes sense, but it''s unclear if we''ll be able to do so for each Hotfix. Again, we''re looking forward to feedback here.
In the meantime, also note that symbol files may no longer match a module if a framework DLL has been updated via a Hotfix. In those cases, the modules window will indicate that the symbols could not be downloaded for that module. Assuming a new symbol file was published, it can be downloaded and cached using “Load Symbols”.
No, you''ll get an HTTP 400 (Bad Request) response.
If you have any other questions, please visit our new MSDN Forum on the topic: Reference Source Server Discussion.
Thanks!
Published Wednesday, January 16, 2008 2:02 PM by sburke
Filed under: Source