For a multiple line chart, a legend should be added to each line, which can be achieved by the legend() function.
For this function, two list parameters can be passed in, of which the first list parameter (handles parameter) is used to refer to each line on the line chart; the second list parameter (labels) represents the added value for each linelegend.
You can come here if you have any python-related error answers that you can't answer, or source code/module installation/
women's clothing bosses are proficient in skills: (https://jq.qq.com/?_wv=1027&k=dwzSWSBK) or +V: python10010 ask me
The following program demonstrates adding a legend to two polylines:
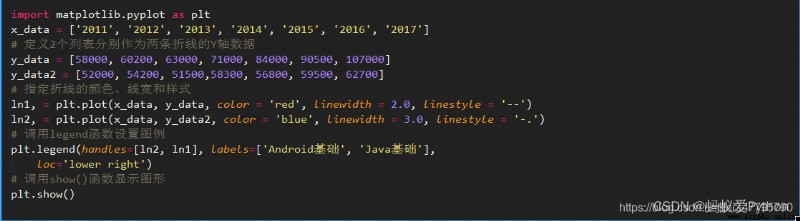
The above program is calling the plot() function to draw a line graph
Get the return value of this function.
Since the return value of this function is a list,
And here you only need to get the first element of the list it returns (the first element represents the line chart drawn by the function),
So the program uses the sequence unpacking of the return value to get it.
In the above program, the 11th line of code is used to add a legend to the polyline represented by ln2 and ln1 (one-to-one correspondence according to the element order of the two lists passed to the function),
The loc parameter specifies the location where the legend is added. This parameter supports the following parameter values:
'best': Automatically select the best location.
'upper right': Place the legend in the upper right corner.
'upper left': Place the legend in the upper left corner.
'lower left': Place the legend in the lower left corner.
'lower right': Place the legend in the lower right corner.
'right': Place the legend on the right.
'center left': Center the legend on the left.
'center right': Center the legend on the right.
'lower center': Center the legend at the bottom.
'upper center': Center the legend at the top.
'center': Center the legend.
Run the above program, you will find that the application does not draw a legend,
This is because Matplotlib does not support Chinese fonts by default.
If you want to modify Matplotlib's default fonts in your program,
You can follow these steps:
Use the FontProperties class under the matplotlib.font_manager submodule to load Chinese fonts.
The Chinese font is specified through the prop attribute when calling the legend() function.
Change line 11 of the above program to the following lines:

The above program uses the FontProperties class to load C:Windows\The Chinese font corresponding to the Fonts\simkai.ttf file,
Therefore, it is necessary to ensure that the system can find the Chinese fonts in this path.
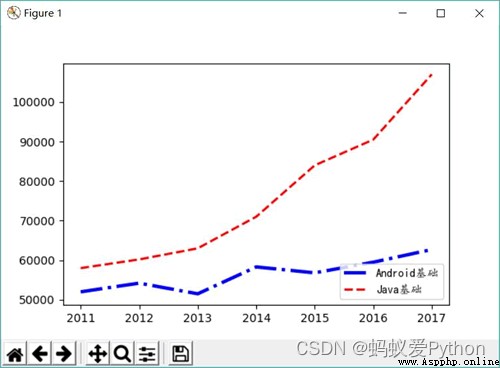
Run the above program again, and you will see the effect shown in Figure 1.
You can not specify handles when using the legend() functionparameter, only the labels parameter is passed in, so that the labels parameter will add a legend to the multiple lines in the line chart in sequence.Therefore, line 5 above can be changed to the following form:
plt.legend(labels=['Java base','Android base'],
loc='lower right',prop=my_font)
The above code only specifies the labels parameter. The list passed in by this parameter contains two strings. The first string will be used as the legend of the first polyline (dashed line), and the second string will be used as the second string.Legend for a polyline (short line, dotted line).
Matplotlib also allows to pass in the label parameter for each polyline when calling the plot() function, so that the program does not need to pass in the labels and handles parameters when calling the legend() function.For example, the following program:

The above program passes the input when calling the plot() functionThe label parameter is set, so that each polyline already has a legend, so the program does not need to pass in the labels parameter when calling the legend() function to generate a legend.
As you can see from the above program, you need to set the font every time you draw Chinese content, so is it possible to change the default font of Matplotlib?The answer is yes.Enter the following two lines in the Python interactive interpreter:
import matplotlib
matplotlib.matplotlib_fname()
‘D:\Python\Python36\lib\site-packages\matplotlib\mp1-data\matplotlibrc’
The matplotlib_fname() function will display the location where the Matplotlib configuration file is saved. Here, the storage path of the file is displayed as D:\Python\Python36\lib\site-packages\matplotlib\mpl-data\matplotlibrc.Open the file and find the following line of code:
#font.family:sans-serif
The above line of code is used to configure the default font of Matplotlib, cancel the comment symbol (#) before running the configuration code, and modify the following sans-serif to the local Chinese font.For example, to use Microsoft Yahei font, just modify the above configuration code to the following form:
font.family: Microsoft YaHei
With the above settings, you can change the default font of Matplotlib, so as to avoid the need to specify an additional font each time the legend() function is called.
You can come here if you have any python-related error answers that you can't answer, or source code/module installation/
women's clothing bosses are proficient in skills: (https://jq.qq.com/?_wv=1027&k=dwzSWSBK) or +V: python10010 ask me