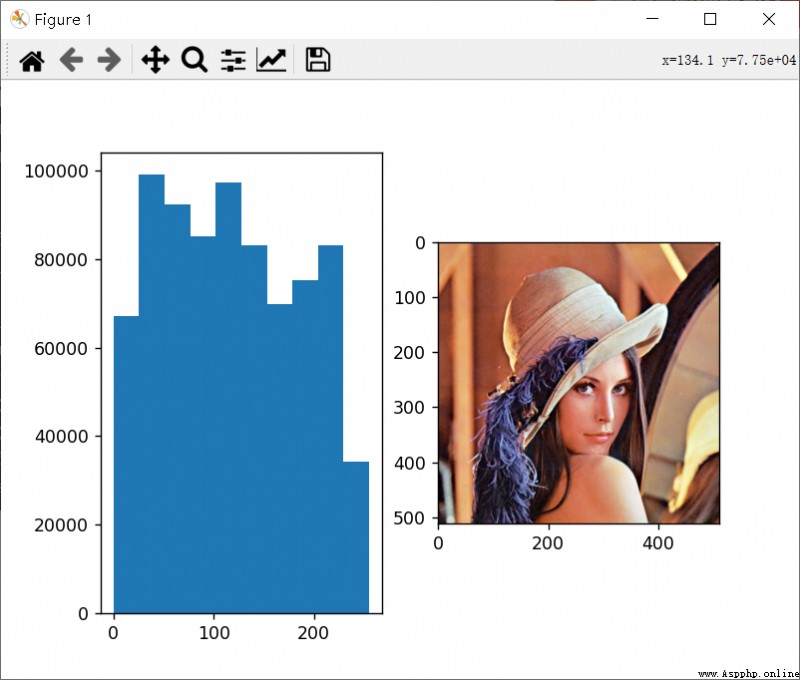
圖像直方圖,本質上就是對圖像的所有像素點的取值進行統計,在不同的橫軸子區間內各有的像素點的數量作為縱軸取值。
在Matplotlib模塊中,有一個pyplot.hist函數,可以統計數組的取值在不同區間上的發生頻率,也即計算直方圖。
語法格式如下,參考官方API文檔:
matplotlib.pyplot.hist(x, bins=None, range=None, density=False, weights=None, cumulative=False, bottom=None, histtype='bar', align='mid', orientation='vertical', rwidth=None, log=False, color=None, label=None, stacked=False, *, data=None, **kwargs)
因為涉及到的參數很多,我們就挑重點講。
下面分享一個案例。
import cv2 as cv
import matplotlib.pyplot as plt
img = cv.imread('images/lena.png')
plt.figure()
plt.subplot(1,2,1)
arr = plt.hist(img.ravel())
plt.subplot(1,2,2)
plt.imshow(img[:, :, ::-1])
plt.show()
print(img.ravel())
print(arr)
cv.waitKey()
cv.destroyAllWindows()
OpenCV中的calcHist函數只能用來計算圖像直方圖對應的數字信息,而無法像matplotlib.pyplot的hist函數一樣直接在執行完後還能將直方圖繪制出來。
OpenCV中的calcHist函數的語法格式如下。
cv.calcHist(images, channels, mask, histSize, ranges[, hist[, accumulate]])
計算得到hist後,如果想要繪制折線型直方圖,可以用plt.plot(hist)——並未涉及顏色和線型等格式的設置,只是想在這裡簡略提到,給讀者一個思路。
numpy中的histogram函數與OpenCV中的calcHist函數一樣,都不能直接繪直方圖,都只能得到各bin內的像素計數。
但是!!!OpenCV中的calcHist函數以及matplotlib的hist函數的bins劃分方式都是左閉右開,只有最右邊的一個區間才是全閉,比如[0, 1),[1, 0),...,[244, 255];而numpy中的histogram函數是xxx(下圖由官網截得——OpenCV: Histograms - 1 : Find, Plot, Analyze !!!)

剛開始我以為numpy的這個函數確實如官網所述,但是後來我發現完全不用將bins=256,將range=[0, 256] 。詳見下面的代碼,雖然最後的點是10,在第10個bin中還是包括了像素點10,說明最後一個bin的區間范圍是[9, 10],而不是[9, 9.99]。
import numpy as np
print(np.histogram([[1, 2, 5, 10], [1, 0, 3, 10]], bins=10, range=[0, 10]))
# (array([1, 2, 1, 1, 0, 1, 0, 0, 0, 2], dtype=int64), array([ 0., 1., 2., 3., 4., 5., 6., 7., 8., 9., 10.]))
說明!!!numpy的histogram函數的bins分配機制和其他兩者相同。
下面是numpy的histogram函數的語法格式,源於numpy.histogram — NumPy v1.23 Manual
numpy.histogram(a, bins=10, range=None, normed=None, weights=None, density=None)