參考書目:《深入淺出Pandas:利用Python進行數據處理與分析》
Categorical data can be grouped,And then grouping statistics calculation.
讀取案例數據
import numpy as np
import pandas as pd
data = 'https://www.gairuo.com/file/data/dataset/team.xlsx'
df = pd.read_excel(data)
groupby參數用法
df.groupby(self, by=None, axis=0, level=None,
as_index: bool=True, sort: bool=True,
group_keys: bool=True,
squeeze: bool=False,
observed: bool=False, dropna=True)df.groupby('team').sum() # 按團隊分組對應列相加
df.groupby('team').mean() # 按團隊分組對應列求平均
# 不同列不同的計算方法
df.groupby('team').agg({'Q1': sum, # 總和
'Q2': 'count', # 總數
'Q3':'mean', # 平均
'Q4': max}) # 最大值
df.groupby('team').agg({'Q1': [sum,'std',max] # 三個方法
'Q2': 'count', # 總數
'Q3':'mean', # 平均
'Q4': max}) # 最大值
#If a column by polymerization,Only the column name string,If multiple will pass by the column name list of
#Polymerization methods can be used Pandas Mathematical statistics function 或者 Numpy 的統計函數
#如果是 python Built-in statistical function,直接使用變量,不需要加引號
#If you need to empty values are aggregated,需要傳入 dropna=Flasedf.groupby('team')
df.Q1.groupby('team')
grouped=df.groupby('col')
grouped=df.groupby('col',axis='columns')
grouped=df.groupby(['col1','col2'])
###分組用法
grouped=df.groupby('team')
grouped.get_group('D')
grouped2=df.groupby(['team',df.name.str[0]])
grouped2.get_group('B','H') #B組,名字H開頭
df.groupby('team').groups #Check the packet content(字典)
grouped.groups.indices #組名為鍵,Group index into an array of the dictionary
dgrouped.groups.keys() #Check the grouping name
grouped.Q1
grouped[['Q1','Q2']]
for name,group in grouped:
print(name) #組名str
print(group)#df### 將數據分為兩組
df.groupby(lambda x:x%2==0).sum() #If the index is even divided into two groups
df.groupby(df.index%2==0).sum()
df.groupby(lambda x:x>50) #The index is greater than50
df.groupby(df.index>=50).sum()
df.groupby(lambda x:'Q' in x ,axis=1).sum() #The column name containsQ的
#其他篩選
df.groupby(df.index%2==0) #Odd-even columns
df.groupby(df.name.str[0]) #姓名首字母
df.groupby(df.team.isin(['A','B'])) #A和B,其他,分組
df.groupby([df.name.str[0],df.name.str[1]]) #Name DiYiErGe letters
df.groupby([df.time.date,df.time.hour]) #The date hours groupdf.groupby(df.time.apply(lambda x:x.year)).count() #From the time columntimeExtract the year groups#案例 ,According to the initials as a vowel sound,Consonants group
def get_letter_type(letter):
if letter[0].lower() in 'aeiou':
return '元音'
else:
return '輔音'
df.set_index('name').groupby(get_letter_type).sum()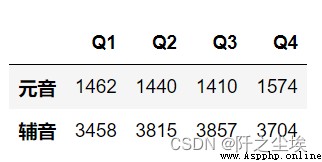
df.groupby(['team',df.name.apply(get_letter_type)]).sum()
#Groupby Group after operation fields will become index,If you don't want to let it become the index,可以使用 as_index=False 進行設置
#Don't want to sort to use sort=False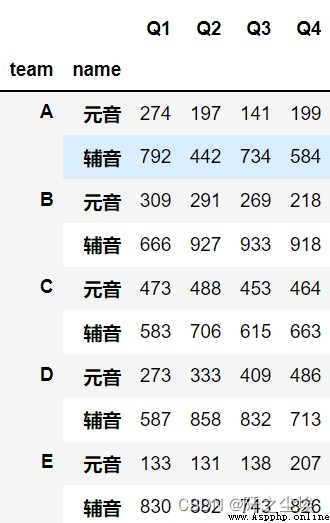
#調用pipe分組用法
df.pipe(pd.DataFrame.groupby,'team').sum()df.groupby('team').apply(lambda x: x*2)
df.groupby('team').apply(lambda x: x['name'].to_list()) #Group a list of output for the list
df.groupby('team').apply(lambda x: x['name'].to_list()).A #To view a group
df.name.groupby('team').apply(np.array) # 輸出一個 np.array# 各組 Q1(為參數) Results before3個
def first_5(df_, c):
return df_[c].sort_values(ascending = False).head(3)
# 調用函數
df.set_index('name').groupby('team').apply(first_5, 'Q1')
# group_keys Can make the grouping field as index
df.set_index('name').groupby('team', group_keys=False).apply(first_5, 'Q1')df.groupby('team').mean()
df.groupby('team').mean().mean(1)
df.groupby('team').filter(lambda x:x.mean(1).mean()>51) #Screening group total score greater than51的人
df.groupby('team').filter(lambda x: len(x) >= 3) # The length of the value is greater than or equal to 3 的
df.groupby(['team']).filter(lambda x: (x['Q1'] > 97).any()) # Q1Result as long as there is a greater than97的組
df.groupby(['team']).filter(lambda x: (x.mean() >= 60).all())# All the members of the average score is greater than 60 的組
df.groupby('team').filter(lambda g: g.Q1.sum() > 1060) # Q1 All the members of the result more than the sum of 1060 的組df.groupby('team').first() # The first in the group
df.groupby('team').last() # Group within the last one
df.groupby('team').ngroups # 5 (分組數)
df.groupby('team').ngroup() # 分組序號
grouped=df.groupby('team')
grouped.backfill()
grouped.bfill()
grouped.head(2)#每組前2個
grouped.tail(1)#Each group of the last one
grouped.rank() #Within the group ordering value
grouped.fillna(0)
#Grouping which values
grouped.nth(1)#第一個
grouped.nth(-1)#最後一個
grouped.nth([2,-1])
grouped.shift(-1)#Within the group to move
grouped.tshift(1)#Time period to move#僅series可用 Return and index
grouped.Q1.nlargest(2) #Each group of two largest
grouped.Q1.nsmallest(3) #Each group of minimum two
grouped.Q1.nunique() #Each group to quantity
grouped.Q1.unique() #Each group to weight value
grouped.Q1.value_counts() #Each group of value type and quantity statistics
grouped.Q1.is_monotonic_increasing #Each group is monotone increasing
grouped.Q1.is_monotonic_decreasing #Each group is monotone decreasing
#僅df
grouped.corrwith(df2) #計算相關性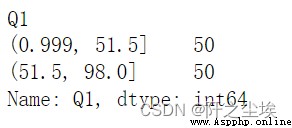
df.groupby('team').describe() # 描述性統計
df.groupby('team').sum() # 求和
df.groupby('team').count() # 每組數量,不包括缺失值
df.groupby('team').max() # 求最大值
df.groupby('team').min() # 求最小值
df.groupby('team').size() # 分組數量
df.groupby('team').mean() # 平均值
df.groupby('team').median() # 中位數
df.groupby('team').std() # 標准差
df.groupby('team').var() # 方差
grouped.corr() # 相關性系數
grouped.sem() # 標准誤差
grouped.prod() # 乘積
grouped.cummax() # Each group of accumulated maximum
grouped.cumsum() # 累加
grouped.mad() # 平均絕對偏差
grouped.median()#中位數
grouped.quantile()#中位數
grouped.quantile(0.75)#四分位
grouped.diff() #Interclass difference before and after# All the columns using a calculation method to calculate
df.groupby('team').aggregate(sum)
df.groupby('team').agg(sum)
grouped.agg(np.size)
grouped['Q1'].agg(np.mean)
# All the columns specify more than one calculation method
grouped.agg([np.sum, np.mean, np.std])
# The specified column using multiple calculation method
grouped[['Q1','Q3']].agg([sum, np.mean, np.std])
# A list of calculation method using multiple
df.groupby('team').agg({'Q1': ['min', 'max'], 'Q2': 'sum'})
# 指定列名,List is for the original column and method
df.groupby('team').Q1.agg(Mean='mean', Sum='sum')
df.groupby('team').agg(Mean=('Q1', 'mean'), Sum=('Q2', 'sum'))
df.groupby('team').agg(Q1_max=pd.NamedAgg(column='Q1', aggfunc='max'),
Q2_min=pd.NamedAgg(column='Q2', aggfunc='min'))
# If the column name is not valid python 變量,則可以用以下方法
df.groupby('team').agg(**{'1_max':pd.NamedAgg(column='Q1', aggfunc='max')})# lambda/函數 All the methods can be used
def max_min(x):
return x.max() - x.min() # 定義函數
df.groupby('team').agg(max_min)
df.groupby('team').Q1.agg(Mean='mean',
Sum='sum',
Diff=lambda x: x.max() - x.min(),
Max_min=max_min)
# 不同列不同的計算方法
df.groupby('team').agg({'Q1': sum, # 總和
'Q2': 'count', # 總數
'Q3':'mean', # 平均
'Q4': max}) # 最大值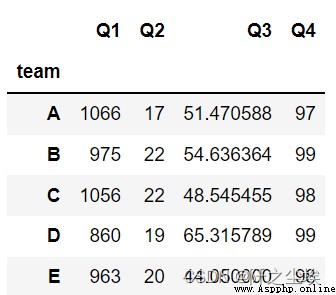
idx = pd.date_range('1/1/2000', periods=100, freq='T')
df2 = pd.DataFrame(data=1 * [range(2)],index=idx,
columns=['a', 'b'])
# Three cycles a polymerization(A minute a cycle)
df2.groupby('a').resample('3T').sum()
# 30 S a group
df2.groupby('a').resample('30S').sum()
# 每月
df2.groupby('a').resample('M').sum()
# At the right time for the logo
df2.groupby('a').resample('3T', closed='right').sum()pd.cut(df.Q1, bins=[0, 60, 100]) #將Q1Performance is divided into two range
df.Q1.groupby(pd.cut(df.Q1, bins=[0, 60, 100])).count() #Become a classification variables and then grouping statistics
df.groupby(pd.cut(df.Q1, bins=[0, 60, 100])).count() #The data frame packet
pd.cut(df.Q1, bins=[0, 60, 100],labels=False) # Don't show the range,Using a digital as a label(0,1,2,n)
pd.cut(df.Q1, bins=[0, 60, 100],labels=['不及格','及格',]) # 指定標簽名
pd.cut(df.Q1, bins=[0, 60, 100], include_lowest=True) # Contains the lowest part of the
pd.cut(df.Q1, bins=[0, 89, 100], right=False) # Does it include the right,閉區間,下例 [89, 100)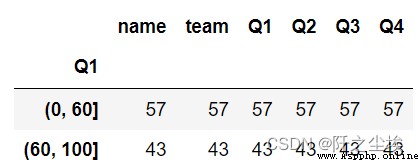
#Different grade map case
df3 = pd.DataFrame({'A':[1, 3, 5, 7, 9]})
df3.assign(B=pd.cut(df3.A, [0,5,7, float('inf')], labels=['差','中','好']))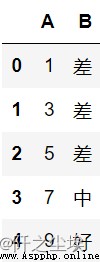
pd.qcut(df.Q1,q=2) #自動分為2組,And the sample length is the same
pd.qcut(df.Q1,q=2).unique()
pd.qcut(df.Q1,q=3).value_counts()
df.groupby(pd.qcut(df.Q1,2)).count() #To the group
#其他參數
pd.qcut(range(5), 4)
pd.qcut(range(5), 4, labels=False)
# 指定標簽名
pd.qcut(range(5), 3, labels=["good", "medium", "bad"])
# Return box labels array([ 1. , 51.5, 98. ]))
pd.qcut(df.Q1,q=2, retbins=True)
# Points space decimal digits
pd.qcut(df.Q1,q=2,precision=3)
# 排名分3個層次
pd.qcut(df.Q1.rank(method='first'),3)
grouped=df.set_index('name').groupby('team')
grouped.plot(figsize=(4,0.8))
grouped.hist() #直方圖hist()
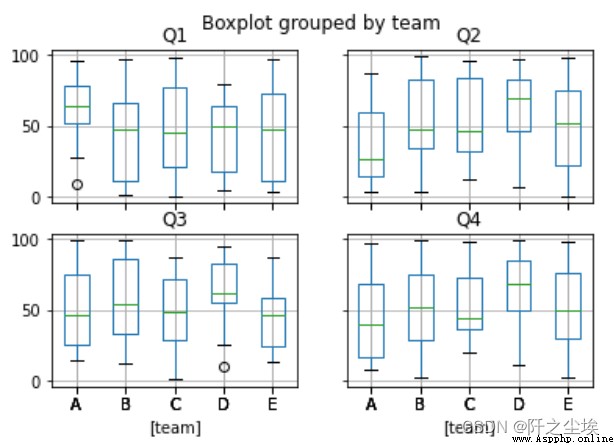
grouped.boxplot()#箱線圖
##或者是
df.boxplot(by='team')