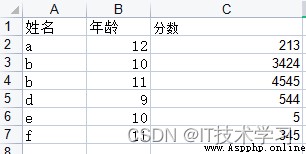
import pandas as pddf_1 = pd.read_excel('stu.xls')help(df_1.pivot_table)pivot_table(values=None, index=None, columns=None, aggfunc='mean', fill_value=None, margins=False, dropna=True, margins_name='All', observed=False, sort=True)
index : The header name of the original table.Explanation: The first column of the pivot table (the header of each row of the pivot table)columns : The header name of the original table.Explanation: The first row of the pivot table (the header of each column of the pivot table)values: The header name of the original table.Explanation: The content of the pivot table, which column of data is subject to.aggfunc : aggregate function, default is averagenp.sum() //summation;np.prod() //Multiply all elements;np.mean() //mean value;np.std() //Standard deviation;np.var() //variance;np.median() //median;np.power() //Power operation;np.sqrt() // square root;np.min() //minimum value;np.max() //Maximum value;np.argmin() //The subscript of the minimum value;np.argmax() //The subscript of the maximum value;np.inf //infinity;np.exp(10) //exponent with base e;np.log(10) //logarithmfill_value : blank data, set the fill contentmargins : whether to add row and column totalsdropna : The default is True, if all values of the column are NaN, it will not be used as a calculated column, when False, it will be retainedmargins_name : the name of the summary row and column, the default is Allobserved : whether to display observationssort : whether the result is sorted
import pandas as pdimport numpy as npdf_1 = pd.read_excel('stu.xls')#aggfunc='count' countdf_1_r = pd.pivot_table(df_1, index='age', columns='name', values='score', aggfunc='count', margins=True,margins_name='Total', fill_value=0)df_1_r.to_excel('1.xlsx')