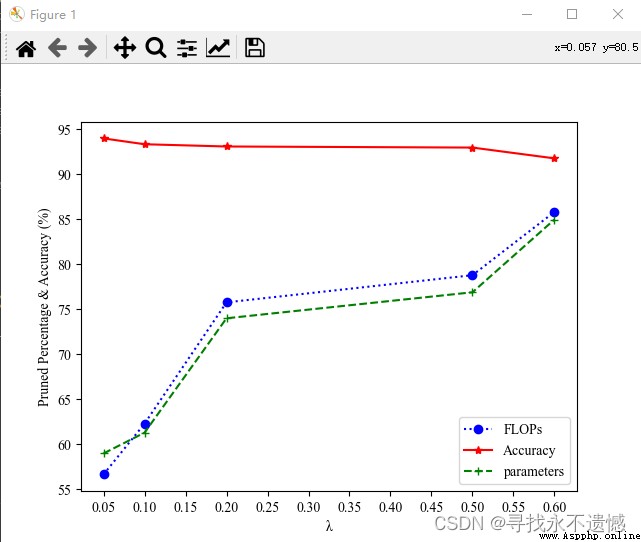
很簡單,直接看代碼以及結果圖。
代碼:
import matplotlib.pyplot as plt
from matplotlib.pyplot import MultipleLocator
lambda1 = [0.05, 0.1, 0.2, 0.5, 0.6]
accuracy = [93.99, 93.34, 93.09, 92.97, 91.77]
flops = [56.63, 62.27, 75.76, 78.78, 85.82]
params = [58.96, 61.27, 73.99, 76.88, 84.97]
plt.plot(lambda1, flops, c='blue', marker='o', linestyle=':', label='FLOPs')
plt.plot(lambda1, accuracy, c='red', marker='*', linestyle='-', label='Accuracy')
plt.plot(lambda1, params, c='green', marker='+', linestyle='--', label='parameters')
#設置圖例並且設置圖例的字體及大小
font1 = {
'family': 'Times New Roman', 'weight': 'normal', 'size': 10}
plt.xticks(fontproperties = 'Times New Roman',fontsize=10)
plt.yticks(fontproperties = 'Times New Roman',fontsize=10)
plt.xlabel(u'λ', font1)
plt.ylabel(u'Pruned Percentage & Accuracy (%)', font1)
# 圖例展示位置,數字代表第幾象限
plt.legend(loc=4, prop=font1)
# Axes(ax)對象,主要操作兩個坐標軸間距
x_major_locator = MultipleLocator(0.05)
ax = plt.gca()
ax.xaxis.set_major_locator(x_major_locator)
plt.show()
結果展示:
