從書籍配套資源下載源代碼,獲得數據文件sitka_weather_07-2014.csv到project文件夾下
打開srv文件,獲取srv首行頭文件數據,且對應其其索引打印出來
# highs_lows.py
import csv
from sqlalchemy import column
file_name = 'sitka_weather_07-2014.csv'
with open(file_name) as f:
reader = csv.reader(f)
header_row = next(reader)
# 調用next()一次,因此得到的是文件的第一行數據
for index, column_header in enumerate(header_row):
# 使用enumerate()獲得每個元素的索引及其值
print(index, column_header)
獲取Max temperature列的數據
# highs_lows.py
--snip--
with open(filename) as f:
highs=[]
--snip--
for row in reader:
highs.append(int(row[1]))
# 從首行文件頭可知處於第二列的 Max TemperatureF 及為高溫度
print(highs)
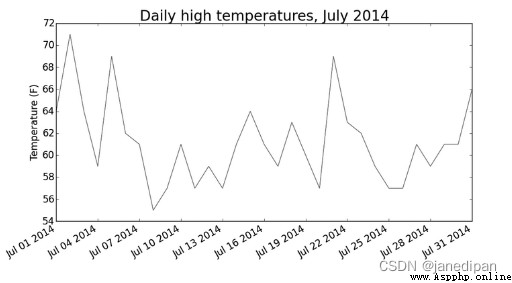
將所獲取的highs利用matplotlib的pyplot模塊,用plot()繪制出折線圖
# highs_lows.py
--snip--
fig = plt.figure(dpi=128, figsize=(10, 6))
plt.plot(highs, c='red')
plt.title('Daily high temperatures, July 2014', fontsize=24)
plt.xlabel('Daily', fontsize=16)
plt.ylabel('Temperature (F)', fontsize=16)
plt.tick_params(axis='both', which='major', labelsize=16)
plt.show()
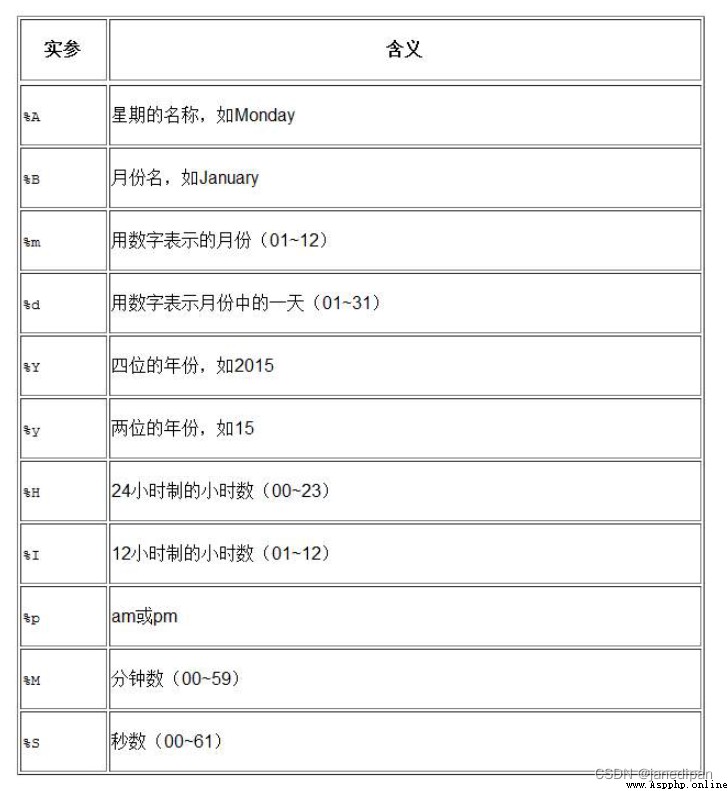
使用datetime模塊中的datetime類,調用strptime()方法接收各種實參,並因此決定解讀日期
>>>from datetime import datetime
>>>first_data = datetime.strptime('2014-7-1', '%Y-%m-%d')
>>>Xprint(first_date)
2014-07-01 00:00:00

# highs_lows.py
import csv
from matplotlib import pyplot as plt
from datetime import datetime
file_name = 'sitka_weather_07-2014.csv'
with open(file_name) as f:
reader = csv.reader(f)
header_row = next(reader)
head_file = {
}
dates, highs = [], []
# 調用next()一次,因此得到的是文件的第一行數據
for index, column_header in enumerate(header_row):
# 使用enumerate()獲得每個元素的索引及其值
head_file[index] = [column_header]
#print(index, column_header)
for row in reader:
# 提取每行數據
highs.append(int(row[1]))
# 從首行文件頭可知處於第二列的 Max TemperatureF 及為高溫度
current_date = datetime.strptime(row[0], "%Y-%m-%d")
dates.append(current_date)
# print(highs)
fig = plt.figure(dpi=128, figsize=(10, 6))
plt.plot(dates, highs, c='red')
plt.title('Daily high temperatures, July 2014', fontsize=24)
plt.xlabel('Daily', fontsize=16)
fig.autofmt_xdate()
# 繪制傾斜的日期
plt.ylabel('Temperature (F)', fontsize=16)
plt.tick_params(axis='both', which='major', labelsize=16)
plt.show()

新增lows列表變量,記錄2014的最低溫度值,用於後續plot()方法中繪制出來
# highs_lows.py
import csv
from matplotlib import pyplot as plt
from datetime import datetime
file_name = 'sitka_weather_2014.csv'
with open(file_name) as f:
reader = csv.reader(f)
header_row = next(reader)
head_file = {
}
dates, highs, lows = [], [], []
# 調用next()一次,因此得到的是文件的第一行數據
for index, column_header in enumerate(header_row):
# 使用enumerate()獲得每個元素的索引及其值
head_file[index] = [column_header]
#print(index, column_header)
for row in reader:
# 提取每行數據
highs.append(int(row[1]))
lows.append(int(row[3]))
# 從首行文件頭可知處於第二列的 Max TemperatureF 及為高溫度
current_date = datetime.strptime(row[0], "%Y-%m-%d")
dates.append(current_date)
# print(highs)
fig = plt.figure(dpi=128, figsize=(10, 6))
plt.plot(dates, highs, c='red')
plt.plot(dates, lows, c='blue')
plt.title('Daily high temperatures, 2014', fontsize=20)
plt.xlabel('Daily', fontsize=16)
fig.autofmt_xdate()
# 繪制傾斜的日期
plt.ylabel('Temperature (F)', fontsize=16)
plt.tick_params(axis='both', which='major', labelsize=10)
plt.show()
之前的案例已經顯示了最高、低溫度的折線,使用fill_between()方法,接收一個x值和兩個y值,並填充兩個y值系列之間的空間
# highs_lows.py
fig=plt.figure(dpi=128, figsize=(10, 6))
plt.plot(dates, highs, c='red', alpha=0.5)
plt.plot(dates, lows, c='blue', alpha=0.5)
plt.fill_between(dates, highs, lows, facecolor='blue', alpha=0.1)
# alpha參數指定顏色的透明度,0為完全透明,1為完全不透明
本節將使用到JSON格式的交易收盤價數據,並使用json模塊處理它們,對收盤價數據進行可視化,以探索價格變化的周期性
需下載btc_close_2017.json文件
這個文件裡是python列表,每個元素是包含5個鍵值對的字典dic:日期,月份,周數,周幾,收盤價
從Github上下載btc_close_2017.json數據
# btc_close_2017.py
from urllib.request import urlopen
import json
json_url = <.json文件url路徑> # 'https://raw.githubsercontent.com/muxuezi/btc/master/btc_close_2017.json'
response=urlopen(json_url)
# python向Github服務器發送請求btc_close_2017.json
req=response.read()
# 讀取數據
with open(<.json文件物理地址>, 'wb') as f:
# 將數據寫入文件
f.write(req)
file_urllib=json.loads(req)
# 加載json格式,將文件內容轉換成python能處理的格式,與直接下載的文件內容一致
print(file_urllib)
另外可以使用requests模塊get()方法獲取數據
import requests
json_url = <.json文件url地址>
req=requests.get(json.url)
with open (<.json文件物理地址>, 'w') as f:
f.write(req.text)
# req的text屬性可直接讀取文件數據,返回字符串
file_requests=req.json()
# 將json文件的數據轉換成python列表file_requests,與此前file_urllib內容相同
import json
filename='btc_close_2017.json'
with open(filename) as f:
btc_data=json.load(f)
for btc_dict in btc_date:
date = btc_dict['date']
month = int(btc_dict['month'])
week = int(btc_dict['week'])
weekday = btc_dict['weekday']
close = float(btc_dict['close'])
print(' the date is {}, the month is {}, the week is {}, the weekday is {}, the close price is {} RMB'.format(date, month, week, weekday, close))
即可打印列表中每個字典的鍵值對
本例使用pygal來實現收盤價的折線圖
# btc_close_2017.py
import json
import pygal
filename='btc_close_2017.json'
with open(filename) as f:
btc_data=json.load(f)
dates=[]
months=[]
weeks=[]
weekdays=[]
close=[]
for btc_dict in btc_date:
dates.append(btc_dict['date'])
months.append(int(btc_dict['month']))
weeks.append(int(btc_dict['week']))
weekdays.append(btc_dict['weekday'])
close.append(float(btc_dict['close']))
print(len(dates))
line_chart = pygal.Line(x_label_rotation=20, show_minor_x_labels=False)
# x_laber_rotation=20,令x坐標標簽順時針轉20,show_minor_x_laberls=False,令不用顯示所有x軸標簽
line_chart._title = "close price"
line_chart.x_labels = dates
N = 20
line_chart._x_labels_major = dates[::N]
# 設置_xlabels_major屬性,令x軸坐標隔20個顯示一次
line_chart.add('close price', close)
line_chart.render_to_file('images/close price picture.svg')
研究時間序列的趨勢,周期性,噪聲;一般對非線性的趨勢消除,進行logtransformation對數變換
import math
-snip-
print(len(dates))
line_chart = pygal.Line(x_label_rotation=20, show_minor_x_labels=False)
# x_laber_rotation=20,令x坐標標簽順時針轉20,show_minor_x_laberls=False,令不用顯示所有x軸標簽
line_chart._title = "close price logtransfomation"
line_chart.x_labels = dates
N = 20
line_chart.x_labels_major = dates[::N]
# 設置_xlabels_major屬性,令x軸坐標隔20個顯示一次
close_log=[math.log10(n) for n in close]
line_chart.add('close price logtransformation', close_log)
line_chart.render_to_file('images/close price logtransformation picture.svg')
利用json文件中的數據,繪制日均值,以及每周各天的日均值。可以將之前繪圖代碼封裝成函數draw_line(x_data, y_data, title, y_legend),以便重復調用
python中的groupby函數主要的作用是進行數據的分組以及分組後的組內運算,for key group in groupby(列表, lambda c: c.function()),實際上挑選規則是通過函數完成的,只要作用於函數的兩個元素key相同,就能被分到同一組,返回key對應的每一組group;y_list = [v for _, v in y]這一行代碼還不理解,顯然-就是key, [ ]就是一個生成器,用於獲取對應key的group中的元素
from itertools import groupby
# groupby函數的主要作用是進行數據分組以及分組後的組內運算
def draw_line(x_data, y_data, title, y_legend):
xy_map = []
for x, y in groupby(sorted(zip(x_data, y_data)), key=lambda _: _[0]):
y_list = [v for _, v in y]
xy_map.append([x, sum(y_list)/len(y_list)])
x_unique, y_mean = [*zip(*xy_map)]
line_chart = pygal.Line()
line_chart.title = title
line_chart.x_labels = x_unique
line_chart.add(y_legend, y_mean)
line_chart.render_to_file('images/'+title+'.svg')
return line_chart
查看月日均值
# btc_close_2017.py
-snip-
idx_month = dates.index('2017-12-01')
# index()方法用於從列表中找出某個值第一個匹配項的索引值
line_chart_month = draw_line(months[:idx_month], close[:idx_month],
'close monthly average price', 'monthly average price')
line_chart_month
查看周日均值
# btc_close_2017.py
-snip-
idx_month = dates.index('2017-12-01')
# index()方法用於從列表中找出某個值第一個匹配項的索引值
line_chart_month = draw_line(weeks[1:idx_month], close[1:idx_month],
'close weekly average price', 'weekly average price')
line_chart_month