目錄
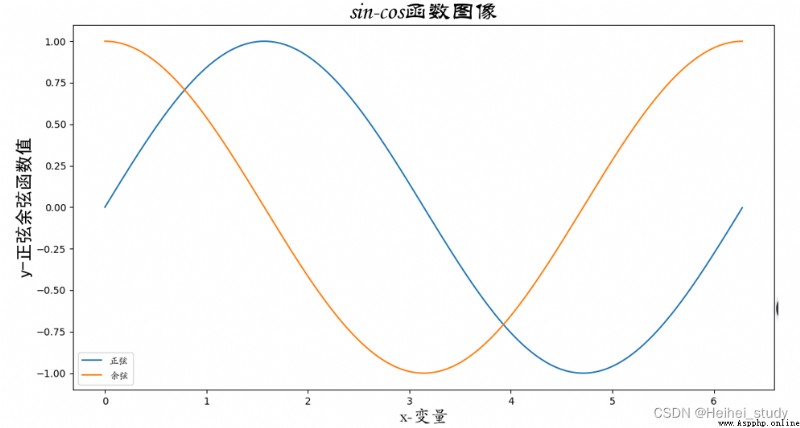
繪制帶有中文標簽和圖例的正弦和余弦曲線
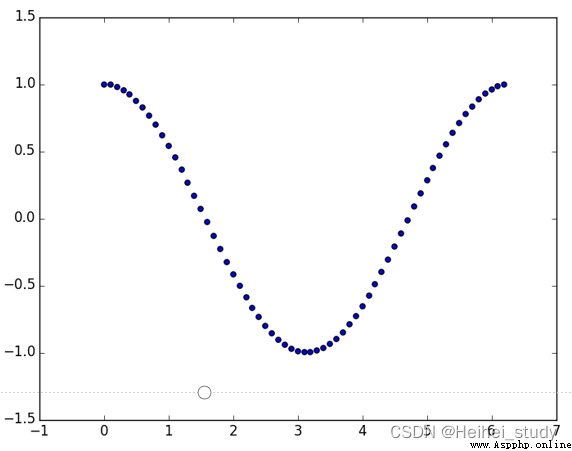
繪制散點圖
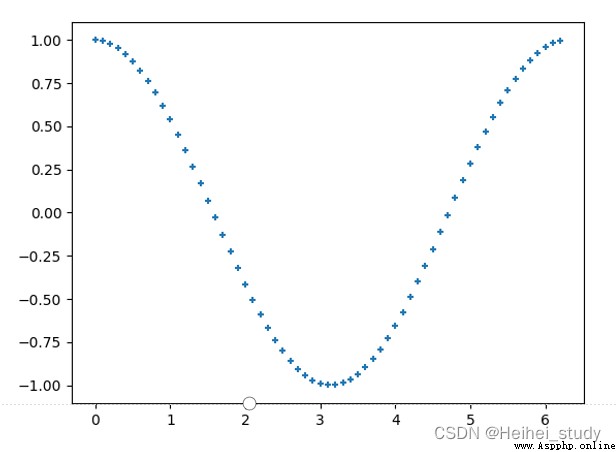
修改散點符號與大小
修改顏色
繪制餅狀圖
在圖例中顯示公式
多個圖像單獨顯示
繪制有描邊和填充效果的柱狀圖
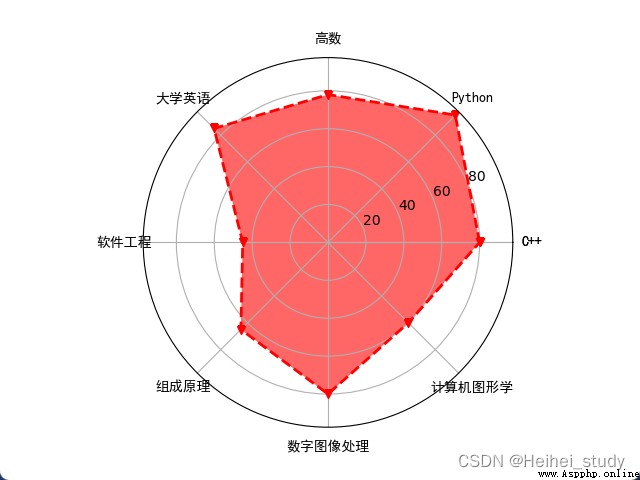
使用雷達圖展示學生成績
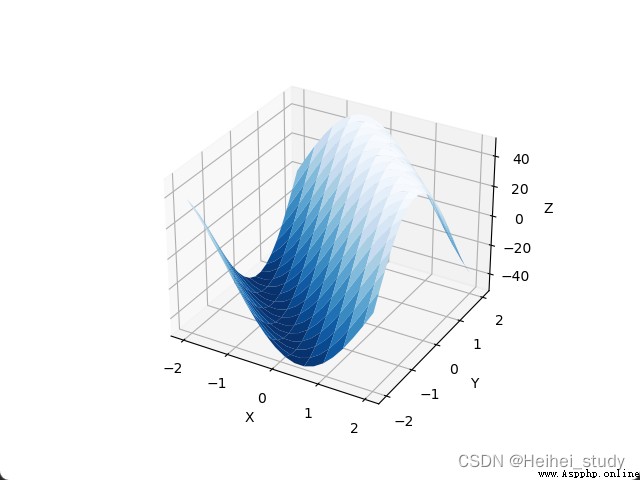
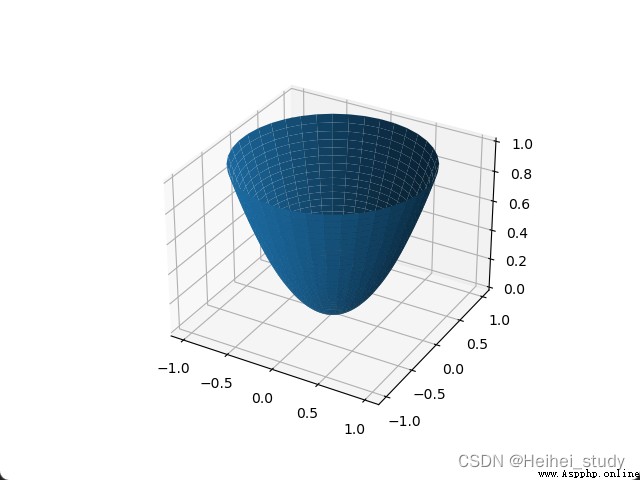
繪制三維曲面
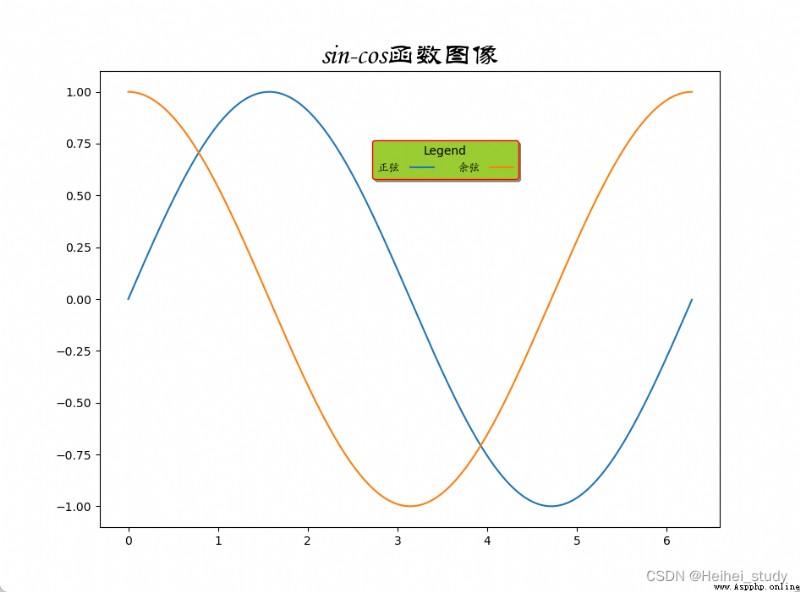
設置圖例樣式
import numpy as np
import pylab as pl
import matplotlib.font_manager as fm
# 必須使用關鍵參數fname,必須保證字體文件路徑正確
myfont = fm.FontProperties(fname=r'C:\Windows\Fonts\STKAITI.ttf') #設置字體
t = np.arange(0.0, 2.0*np.pi, 0.01) # 自變量取值范圍
s = np.sin(t) # 計算正弦函數值
z = np.cos(t) # 計算余弦函數值
pl.plot(t, s, label='正弦')
pl.plot(t, z, label='余弦')
pl.xlabel('x-變量', fontproperties='STKAITI', fontsize=18) # 設置x標簽
pl.ylabel('y-正弦余弦函數值', fontproperties='simhei', fontsize=18)
pl.title('sin-cos函數圖像', fontproperties='STLITI', fontsize=24) # 標題
pl.legend(prop=myfont) # 設置圖例
pl.show()
>>> a = np.arange(0, 2.0*np.pi, 0.1)
>>> b = np.cos(a)
>>> pl.scatter(a,b)
>>> pl.show()
>>> pl.scatter(a, b, s=20, marker='+')
>>> pl.show()
修改顏色
>>> import matplotlib.pylab as pl
>>> import numpy as np
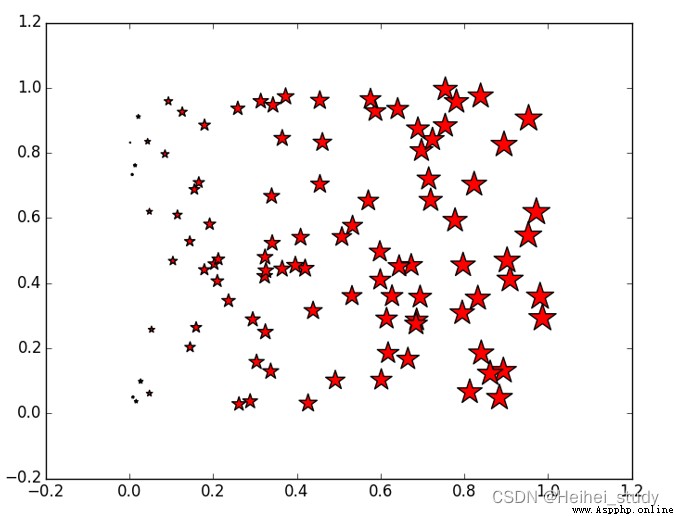
>>> x = np.random.random(100)
>>> y = np.random.random(100)
>>> pl.scatter(x, y, s=x*500, c=u'r', marker=u'*')
# s指大小,c指顏色,marker指符號形狀
>>> pl.show()
import numpy as np
import matplotlib.pyplot as plt
#The slices will be ordered and plotted counter-clockwise.
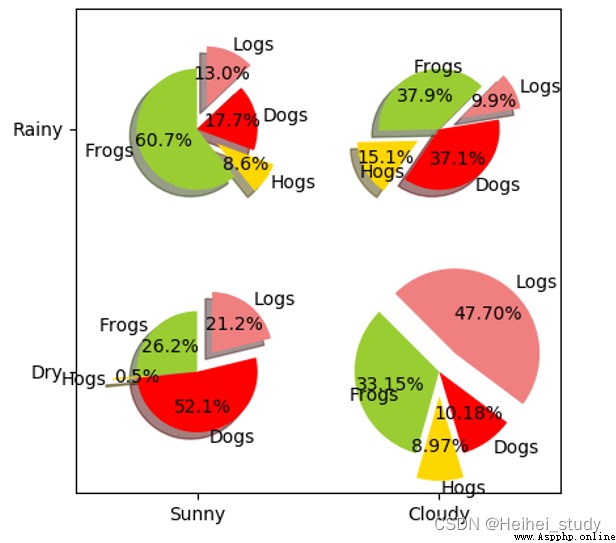
labels = 'Frogs', 'Hogs', 'Dogs', 'Logs'
colors = ['yellowgreen', 'gold', '#FF0000', 'lightcoral']
explode = (0, 0.1, 0, 0.1) # 使餅狀圖中第2片和第4片裂開
fig = plt.figure()
ax = fig.gca()
ax.pie(np.random.random(4), explode=explode, labels=labels, colors=colors,
autopct='%1.1f%%', shadow=True, startangle=90,
radius=0.25, center=(0, 0), frame=True) # autopct設置餅內百分比的格式
ax.pie(np.random.random(4), explode=explode, labels=labels, colors=colors,
autopct='%1.1f%%', shadow=True, startangle=45,
radius=0.25, center=(1, 1), frame=True)
ax.pie(np.random.random(4), explode=explode, labels=labels, colors=colors,
autopct='%1.1f%%', shadow=True, startangle=90,
radius=0.25, center=(0, 1), frame=True)
ax.pie(np.random.random(4), explode=explode, labels=labels, colors=colors,
autopct='%1.2f%%', shadow=False, startangle=135,
radius=0.35, center=(1, 0), frame=True)
ax.set_xticks([0, 1]) # 設置坐標軸刻度
ax.set_yticks([0, 1])
ax.set_xticklabels(["Sunny", "Cloudy"]) # 設置坐標軸刻度上的標簽
ax.set_yticklabels(["Dry", "Rainy"])
ax.set_xlim((-0.5, 1.5)) # 設置坐標軸跨度
ax.set_ylim((-0.5, 1.5))
ax.set_aspect('equal') # 設置縱橫比相等
plt.show()
python使用matplotlib繪制餅狀圖_辰小夏的博客-CSDN博客_matplotlib餅狀圖
python 數據可視化———繪制餅狀圖(bar)_a1227406795的博客-CSDN博客_python餅狀圖
import numpy as np
import matplotlib.pyplot as plt
x = np.linspace(0, 2*np.pi, 500)
y = np.sin(x)
z = np.cos(x*x)
plt.figure(figsize=(8,4))
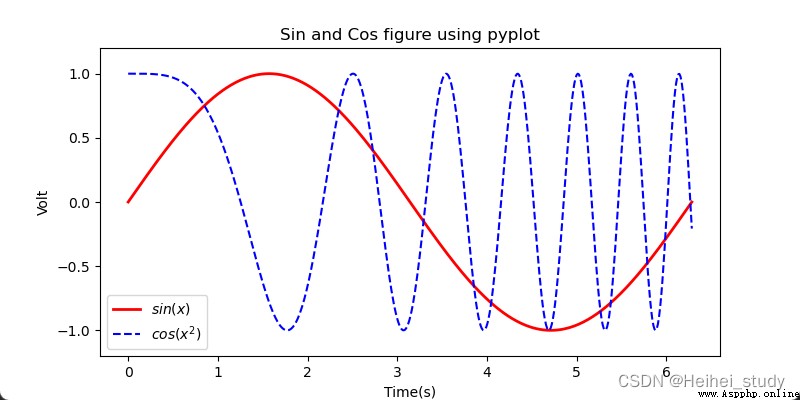
# 標簽前後加$將使用內嵌的LaTex引擎將其顯示為公式
plt.plot(x,y,label='$sin(x)$',color='red',linewidth=2) # 紅色,2個像素寬
plt.plot(x,z,'b--',label='$cos(x^2)$') # 藍色,虛線
plt.xlabel('Time(s)')
plt.ylabel('Volt')
plt.title('Sin and Cos figure using pyplot')
plt.ylim(-1.2,1.2)
plt.legend() # 顯示圖例
plt.show() # 顯示繪圖窗口
import numpy as np
import matplotlib.pyplot as plt
x= np.linspace(0, 2*np.pi, 500) # 創建自變量數組
y1 = np.sin(x) # 創建函數值數組
y2 = np.cos(x)
y3 = np.sin(x*x)
plt.figure(1) # 創建圖形
ax1 = plt.subplot(2,2,1) # 第一行第一列圖形
ax2 = plt.subplot(2,2,2) # 第一行第二列圖形
ax3 = plt.subplot(212, facecolor='y') # 第二行
plt.sca(ax1) # 選擇ax1
plt.plot(x,y1,color='red') # 繪制紅色曲線
plt.ylim(-1.2,1.2) # 限制y坐標軸范圍
plt.sca(ax2) # 選擇ax2
plt.plot(x,y2,'b--') # 繪制藍色曲線
plt.ylim(-1.2,1.2)
plt.sca(ax3) # 選擇ax3
plt.plot(x,y3,'g--')
plt.ylim(-1.2,1.2)
plt.show()
import numpy as np
import matplotlib.pyplot as plt
#生成測試數據
x = np.linspace(0, 10, 11)
y = 11-x
#繪制柱狀圖
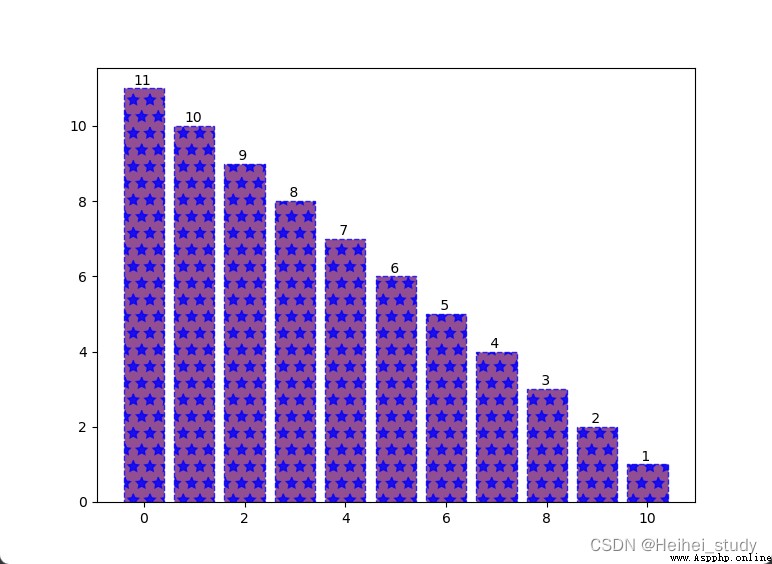
plt.bar(x, y,
color='#772277', #柱的顏色
alpha=0.8, #透明度
edgecolor='blue', #邊框顏色
linestyle='--', #邊框樣式為虛線
linewidth=1, #邊框線寬
hatch='*') #內部使用五角星填充
#為每個柱形添加文本標注
for xx, yy in zip(x,y):
plt.text(xx-0.2, yy+0.1, '%2d' % yy)
#顯示圖形
plt.show()
import numpy as np
import matplotlib.pyplot as plt
courses = ['C++', 'Python', '高數', '大學英語', '軟件工程',
'組成原理', '數字圖像處理', '計算機圖形學']
scores = [80, 95, 78, 85, 45, 65, 80, 60]
dataLength = len(scores) # 數據長度
# angles數組把圓周等分為dataLength份
angles = np.linspace(0, # 數組第一個數據
2*np.pi, # 數組最後一個數據
dataLength, # 數組中數據數量
endpoint=False) # 不包含終點
scores.append(scores[0])
angles = np.append(angles, angles[0]) # 閉合
# 繪制雷達圖
plt.polar(angles, # 設置角度
scores, # 設置各角度上的數據
'rv--', # 設置顏色、線型和端點符號
linewidth=2) # 設置線寬
# 設置角度網格標簽
plt.thetagrids(angles*180/np.pi,
courses,
fontproperties='simhei')
# 填充雷達圖內部
plt.fill(angles,
scores,
facecolor='r',
alpha=0.6)
plt.show()
報錯的解決:
Python繪制雷達圖時遇到的坑的解決_Python-免費資源網
也可以加多一句
courses.append(courses[0])
np.mgrid使用 - 碼農教程
import numpy as np
import matplotlib.pyplot as plt
import mpl_toolkits.mplot3d
x,y = np.mgrid[-2:2:20j, -2:2:20j] # 步長使用虛數
# 虛部表示點的個數
# 並且包含end
z = 50 * np.sin(x+y) # 測試數據
ax = plt.subplot(111, projection='3d') # 三維圖形
ax.plot_surface(x,y,z,rstride=2, cstride=1, cmap=plt.cm.Blues_r)
ax.set_xlabel('X') # 設置坐標軸標簽
ax.set_ylabel('Y')
ax.set_zlabel('Z')
plt.show()
import pylab as pl
import numpy as np
import mpl_toolkits.mplot3d
rho, theta = np.mgrid[0:1:40j, 0:2*np.pi:40j]
z = rho**2
x = rho*np.cos(theta)
y = rho*np.sin(theta)
ax = pl.subplot(111, projection='3d')
ax.plot_surface(x,y,z)
pl.show()
import numpy as np
import matplotlib.pyplot as plt
import matplotlib.font_manager as fm
t = np.arange(0.0, 2*np.pi, 0.01)
s = np.sin(t)
z = np.cos(t)
plt.plot(t, s, label='正弦')
plt.plot(t, z, label='余弦')
plt.title('sin-cos函數圖像', #標題文本
fontproperties='STLITI', #標題字體
fontsize=24) #標題字號
myfont = fm.FontProperties(fname=r'C:\Windows\Fonts\STKAITI.ttf')
plt.legend(prop=myfont, #圖例字體
title='Legend', #圖例標題
loc='lower left', #圖例左下角位於圖形(0.43,0.75)的位置
bbox_to_anchor=(0.43,0.75),
shadow=True, #顯示陰影
facecolor='yellowgreen', #圖例背景色
edgecolor='red', #圖例邊框顏色
ncol=2, #顯示為兩列
markerfirst=False) #圖例文字在前,符號在後
plt.show()
