Data analysis is inseparable from the correlation analysis of data,And these correlations need to be visualized(繪圖),In order to facilitate people to have a more direct correlation between various feature attributes、Clear perception and understanding,Enhance the value of data and the benefits of data mining.本文以“鸢尾花數據集”為基礎,Mainly focus on the drawing of various relationship diagrams,And data visualization for statistical analysis,provided and displayed12A relationship diagram and5A method for statistical analysis of graphs and regression graphs(See the following table of contents for details).
由於從sklearn中獲取的“鸢尾花”數據集中,目標值(iris.target)是“0”和“1”,This type of data is convenient to implement“機器學習”的建模,But it is not conducive to understanding in data plotting,So we will associate the target value in the dataset with the iris species(species)進行關聯,Convert to a new dataset,for better visualization.
 1. 箱型圖
2. 小提琴圖 -- violinplot()
3. 分簇散點圖
4. 散點圖
5. 散點矩陣圖
6. 直方圖矩陣
7. 密度圖
8. 直方密度線圖
9. 熱力圖
10. 平行坐標圖
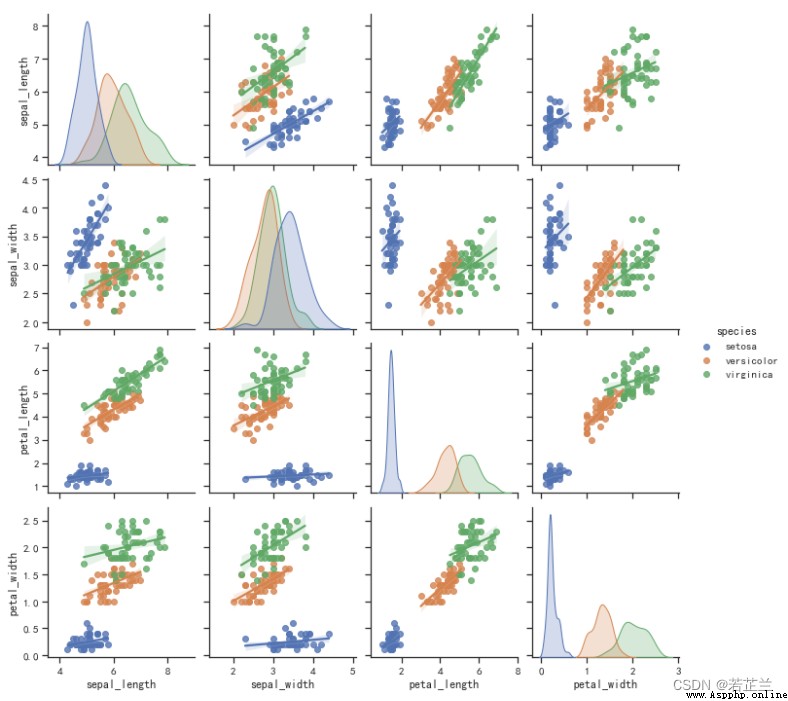
11. Multivariate joint distribution plot -- pairplot()函數
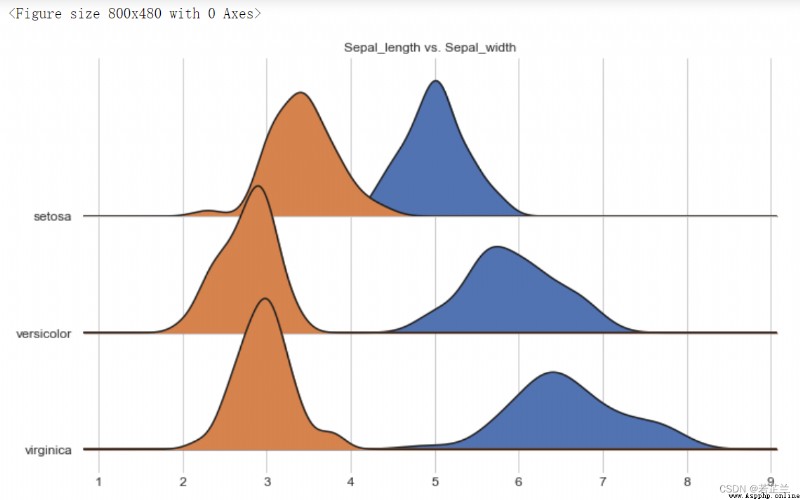
12. Overlapping density plots for multiple groups of classifications -- joy plot() 函數
 1. 檢驗是否符合正態分布 -- p_test, Skewness(), Kurtosis()的計算
2. Normal probability distribution plot
3. 正態分布圖 -- norm.pdf() Calculation and plotting of functions
4. 回歸圖 -- lmplot() 函數
5. 回歸圖 -- regplot() 函數
**鸢尾花數據集(Iris數據集)**是一類多重變量分析的數據集.數據集包含150個數據樣本,分為3類,每類50個數據,每個數據包含4個屬性.通過花萼長度,花萼寬度,花瓣長度,花瓣寬度4attributes that predict which iris flowers belong to(Setosa,Versicolour,Virginica)三個種類中的哪一類.The target value of the original dataset(iris.target)是“0”和“1”,But when it comes to data visualization,To make it clearer and easier to understand the classification of the data,We need to connect the target values in the dataset with the iris species,即:Put the numbers in the dataset"iris.target"Connect with varieties of irises,Convert to a new dataset.
import numpy as np
import pandas as pd
import sklearn
from sklearn import datasets
# 從sklearnGet the iris dataset from ,並轉換為DataFrame
iris = datasets.load_iris()
dataset = pd.DataFrame(iris.data, columns=iris.feature_names)
dataset["target"]= iris.target
# Transform the iris species on the target values in the dataset
dict_species = dict(zip(np.array([0, 1, 2]), iris.target_names,))
dict_species
dataset["speices"] = dataset["target"].map(dict_species)
# The collated data set starts with csv文件的形式保存下來,也可以保存為Excel 文件
outputfile = r"d:/iris.csv"
dataset.to_csv(outputfile)
dataset.info()
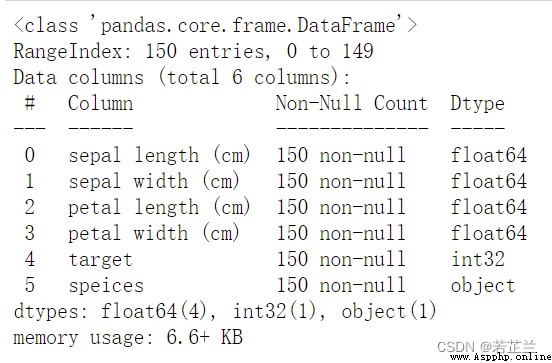
保存下來的csv文件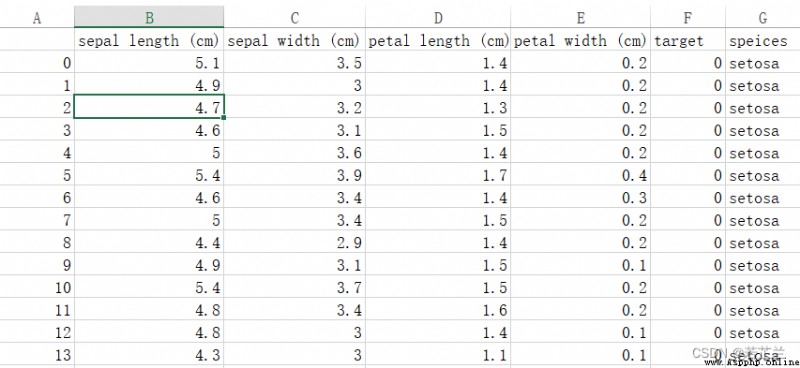
1. 箱型圖
# 1.1 繪制箱型圖 -- Plot box plots based on different categories of data
data = dataset.drop(columns=["species"])
plt.boxplot(data, labels=data.columns, showmeans=True)
plt.show()
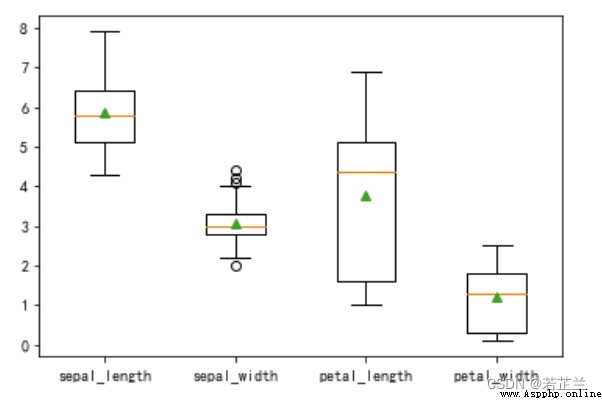
# 1. 2 繪制箱型圖 -- Sepal length and petal length are displayed by iris species
fig, axes = plt.subplots(1, 2, figsize=(10, 5))
sns.boxplot(x="species", y="sepal_length", data=dataset, ax=axes[0])
sns.boxplot(x="species", y="petal_length", data=dataset, ax=axes[1])
plt.show()

2. 小提琴圖 – violinplot() 函數
# 繪制小提琴圖
import seaborn as sns
sns.violinplot(x="species", y="petal_length", data=dataset)
plt.show()
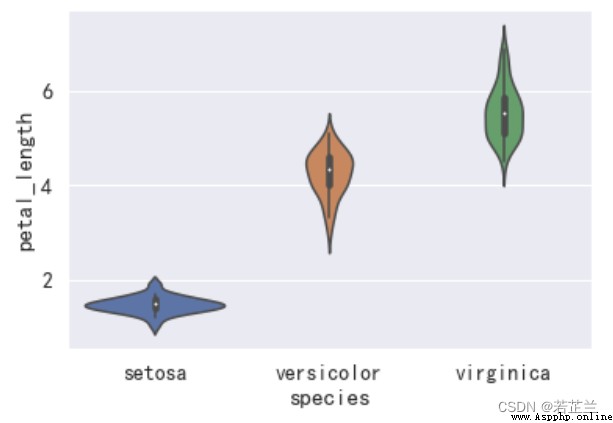
3. 分簇散點圖
# 分簇散點圖
fig, axes = plt.subplots(1, 2, figsize=(10, 5))
sns.swarmplot(x="species", y="sepal_length", data=dataset, ax=axes[0])
sns.swarmplot(x="species", y="sepal_width", data=dataset, ax=axes[1])
plt.show()
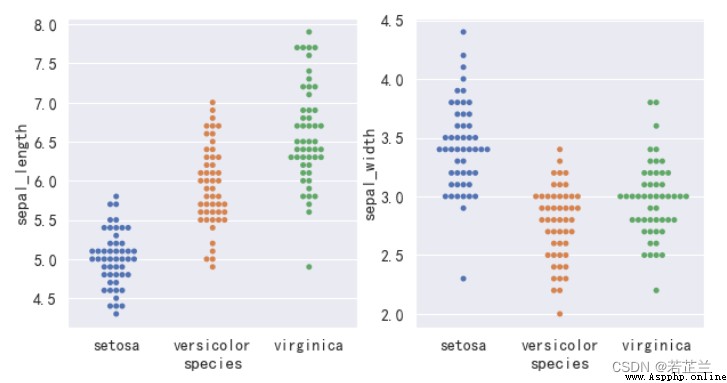
4. 散點圖
# 繪制散點圖
fig = plt.subplots(1, 1, figsize=(8, 4))
sns.scatterplot(x="sepal_length", y="petal_length", hue="species", data=dataset)
plt.show()
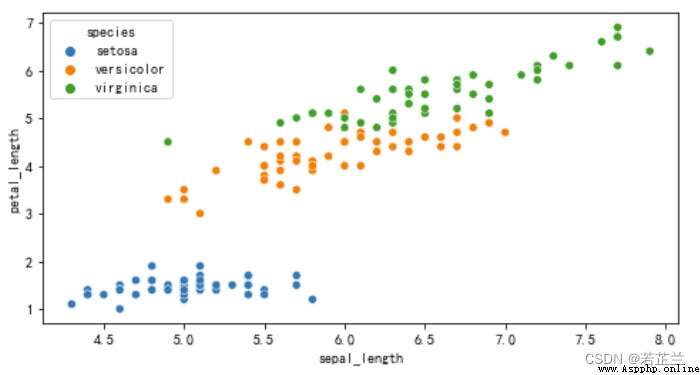
5. 散點矩陣圖
# Example of plotting a scatterplot matrix
import seaborn as sns
sns.set()
sns.pairplot(dataset, vars=["sepal_length", "petal_length"])
plt.show()
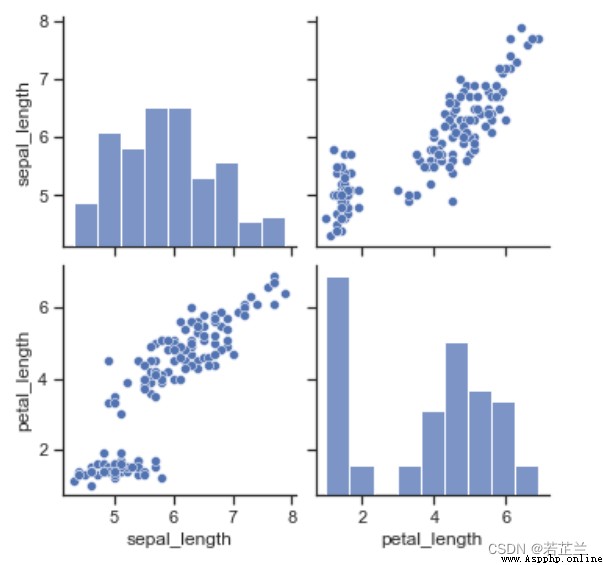
6. 直方圖矩陣
# Plot the histogram matrix -- Plot a histogram over all feature attributes in the dataset
dataset.hist(sharex=True)
plt.show()
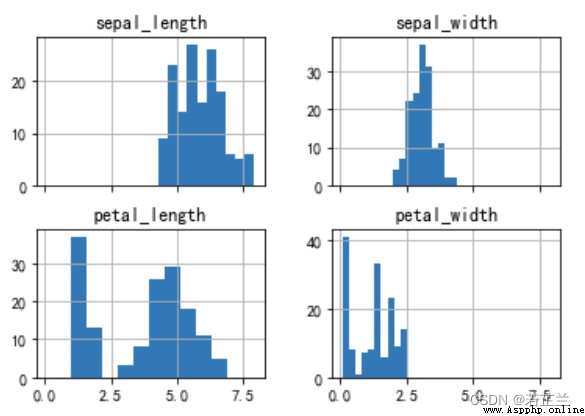
7. 繪制密度圖
# 繪制密度圖 -- 整個數據集
dataset.plot(kind="kde")
plt.show()
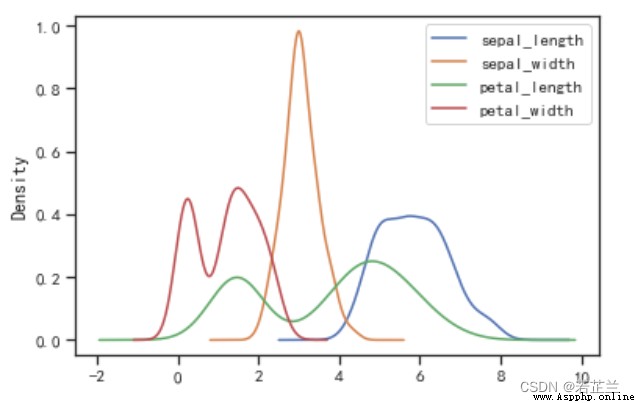
8. 直方密度線圖
# Plot a histogram of density lines -- and presented separately according to different varietiessepal_length數據的分布情況
import seaborn as sns
# kde: Whether to display the data distribution curve,默認為False
sns.displot(x="sepal_length", data=dataset, bins=20, kde=True, hue="species")
plt.show()
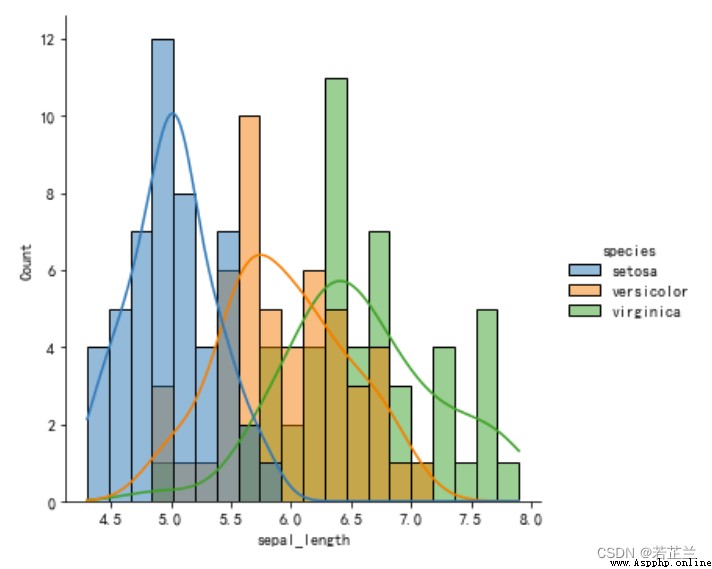
9. 熱力圖
# 繪制熱力圖
corrmat = dataset.corr()
k = 4
cols = corrmat.nlargest(k, "sepal_length")["sepal_length"].index
cm = np.corrcoef(dataset[cols].values.T)
sns.set(font_scale=1.25)
hm = sns.heatmap(cm, cbar=True, annot=True, square=True, fmt=".2f", annot_kws={"size": 10},
yticklabels=cols.values, xticklabels=cols.values)
plt.show()

10. 平行坐標圖
平行坐標圖(Paralllel Coordinates Plot) is a visualization method for having multiple properties,Can be solved as the dimension increases,The problem with scatter matrices becoming less efficient.在平行坐標圖中,數據集的一行數據在平行坐標圖中用一條折線表示,Portrait is a property,橫向是屬性類別.安裝方法:pip install pyecharts
# Example of a parallel coordinates plot of the plotted data
from pyecharts.charts import Parallel
import pyecharts.options as opts
import seaborn as sns
import numpy as np
data_ = np.array(dataset[["sepal_length", "sepal_width", "petal_length", "petal_width"]]).tolist()
parallel_axis = [{"dim": 0, "name": "萼片長度"},
{"dim": 1, "name": "萼片寬度"},
{"dim": 2, "name": "花瓣長度"},
{"dim": 3, "name": "花瓣寬度"}]
parallel = Parallel(init_opts=opts.InitOpts(width="600px", height="400px"))
parallel.add_schema(schema=parallel_axis)
parallel.add("鸢尾花(iris)parallel graph of", data=data_, linestyle_opts=opts.LineStyleOpts(width=4, opacity=0.5))
parallel.render_notebook()
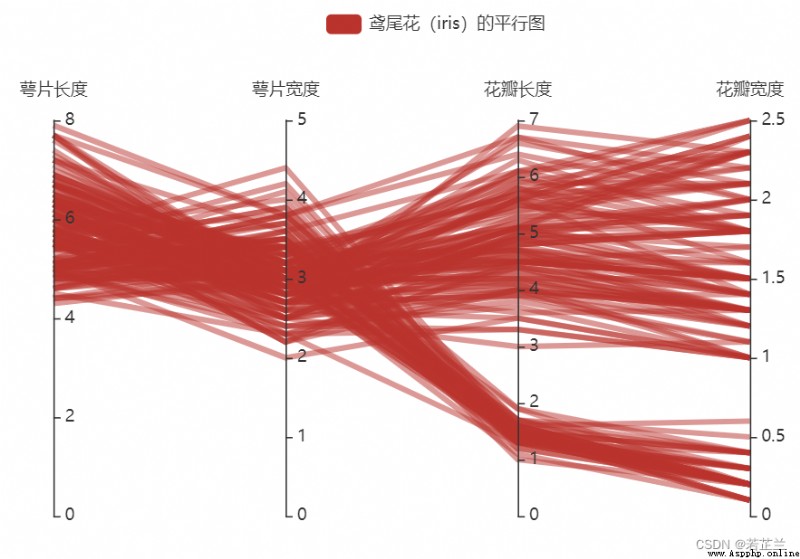
11. Multivariate joint distribution plot – pairplot() 函數
11.1 Circulates correlations between data attributes in the form of a scatterplot
# 11.1:Plots the correlation between data attributes in the form of a scatterplot
import seaborn as sns
plt.figure(figsize=(10, 8), dpi=80)
plot_setting = dict(s=80, edgecolor="white", linewidth=2.5)
sns.pairplot(dataset, kind="scatter", hue="species", plot_kws=plot_setting)
plt.show()
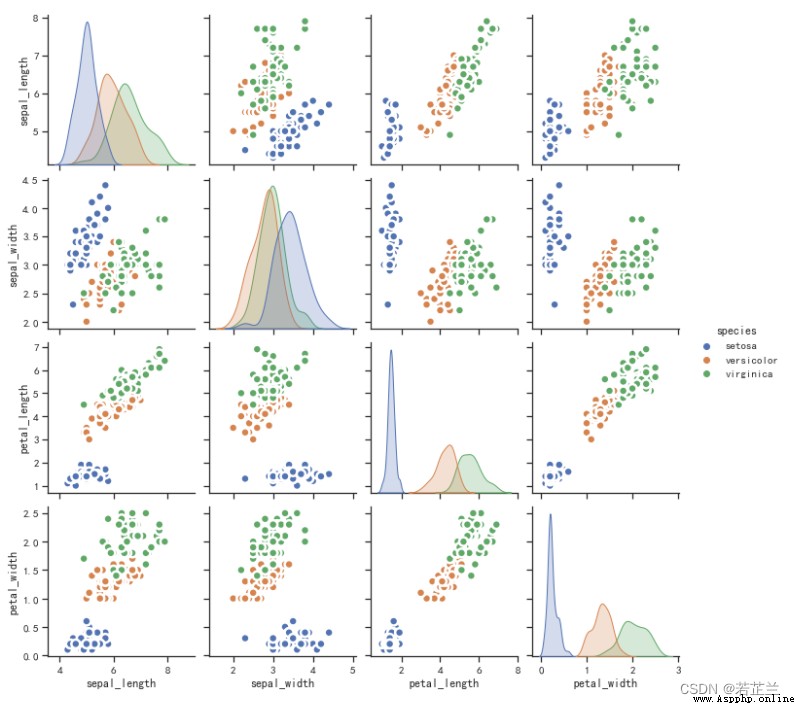
11.2 The correlations between the data attributes are displayed cyclically in the form of regression lines
# 11.2:Plots the correlations between data attributes in a recurring fashion as a regression line
plt.figure(figsize=(10, 8), dpi=80)
sns.pairplot(dataset, kind="reg", hue="species")
plt.show()
12. Overlapping density plots for multiple groups of classifications – Joyplot() 函數
Overlapping density plots for multiple groups of classifications(Joy plot)又稱為“峰巒圖”,is a way to visualize large amounts of grouped data,By partial stacking、Overlaid density plots to show different classes of density curve folds,Visually present and compare the distribution of different groups of data on one dimension.
安裝方法:pip install joyplot
# Joy Plot
import joypy
plt.figure(figsize=(10, 6), dpi=80)
fig, axes = joypy.joyplot(dataset, column=["sepal_length", "sepal_width"], by="species", figsize=(10, 6),
grid=True, title="Sepal_length vs. Sepal_width")
plt.show()
1. 檢驗是否符合正態分布 – p_test, Skewness(), Kurtosis()的計算
# 1.1 Check for normal distribution and skewness(Skewness)和峰度(Kurtosis)
print("偏度(Skewness): %f" % dataset["sepal_length"].skew())
print("峰度(Kurtosis): %f" % dataset["sepal_length"].kurt())
# 在統計學中,峰度(Kurtosis)Measures the kurtosis of the probability distribution of a real random variable.
# High kurtosis means that the increased variance is caused by low frequency extremes of difference greater or less than the mean.

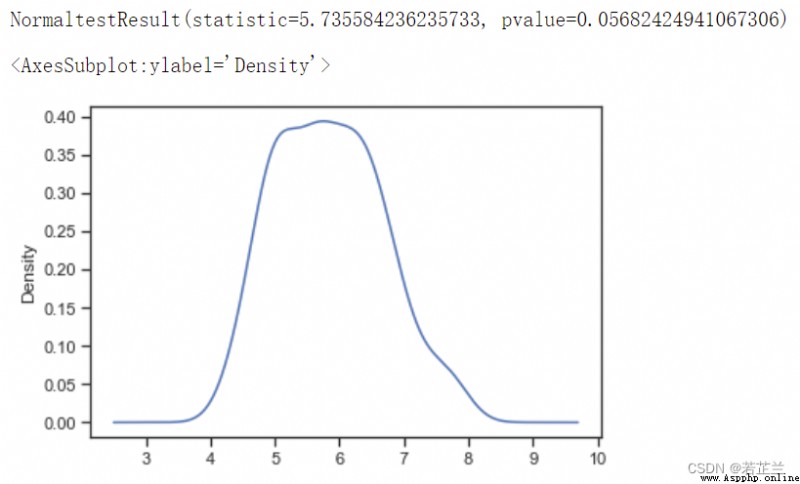
# 1.2Test data for normal distribution andp_test 的計算 -- 分析petal_length是否符合正態分布:
import scipy.stats as ss
p_test= np.array(dataset["sepal_length"].T)
print(ss.normaltest(p_test))
from matplotlib import pyplot as plt
p_test = pd.Series(p_test)
p_test.plot(kind="kde")
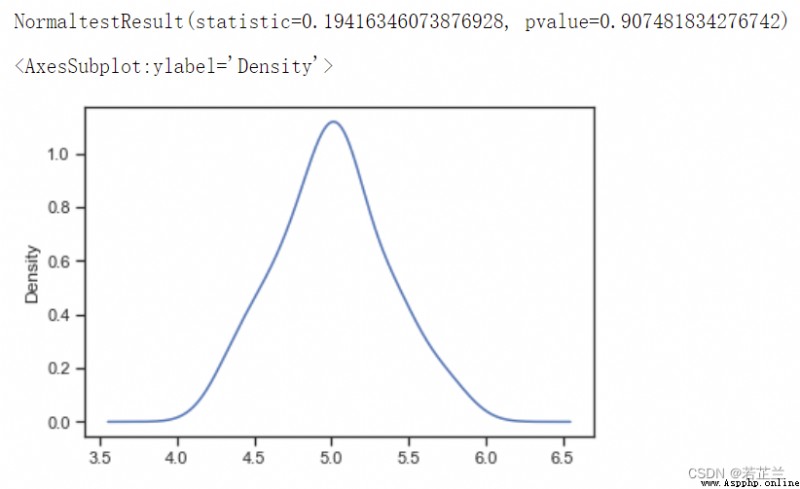
# 2.2 分析petal_length是否符合正態分布:
import scipy.stats as ss
data_ = dataset[dataset["species"] == "setosa"]
p_test= np.array(data_["sepal_length"].T)
print(ss.normaltest(p_test))
from matplotlib import pyplot as plt
p_test = pd.Series(p_test)
p_test.plot(kind="kde")
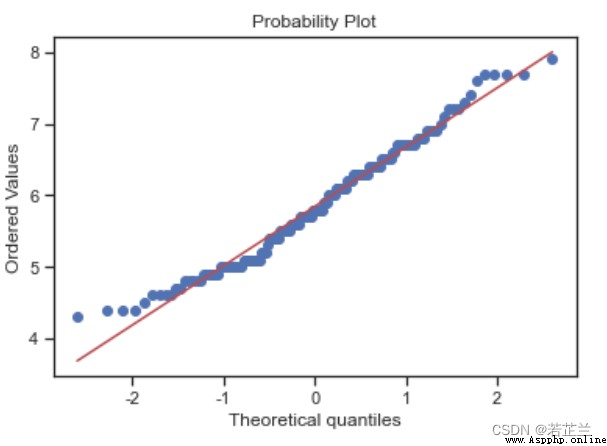
2. Normal probability distribution plot
# Normal probability distribution plot:-- histogram and normal probability plot
from scipy import stats
sns.distplot(dataset["sepal_length"], fit=norm)
fig = plt.figure()
res = stats.probplot(dataset["sepal_length"], plot=plt)

3. 正態分布圖 – norm.pdf() Calculation and plotting of functions
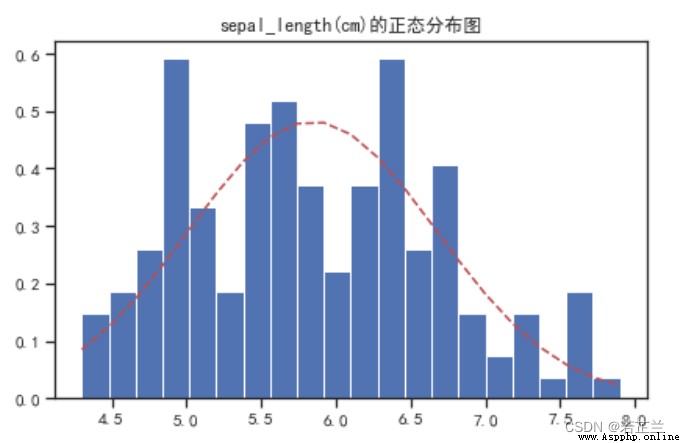
# 3.1 繪制正態分布圖
from scipy.stats import norm
fig, axes = plt.subplots()
sigma = dataset["sepal_length"].std()
mu = dataset["sepal_length"].mean()
num_bins = 20
x = dataset["sepal_length"]
n, bins, patches = axes.hist(x, num_bins, density=1)
# Calculates the probability density function for the normal distribution
y = norm.pdf(bins, mu, sigma)
axes.plot(bins, y, "r--")
axes.set_title("sepal_length(cm)的正態分布圖")
fig.tight_layout()
plt.show()
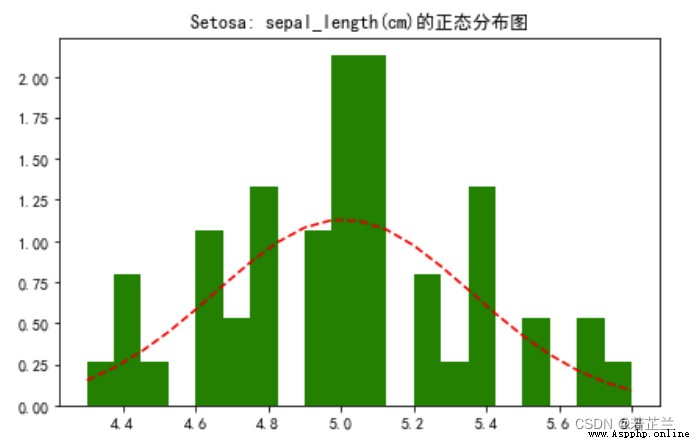
# 3.2 繪制正態分布圖 -- Data analysis focused on the petal length of a species
mpl.rcParams["font.family"] = "SimHei"
data_ = dataset[dataset["species"]=="setosa"]
from scipy.stats import norm
fig, axes = plt.subplots()
sigma = data_["sepal_length"].std()
mu = data_["sepal_length"].mean()
num_bins = 20
x = data_["sepal_length"]
n, bins, patches = axes.hist(x, num_bins, density=1,color="g")
y = norm.pdf(bins, mu, sigma)
axes.plot(bins, y, "r--")
axes.set_title("Setosa: sepal_length(cm)的正態分布圖")
fig.tight_layout()
plt.show()
4. 回歸圖 – lmplot()函數
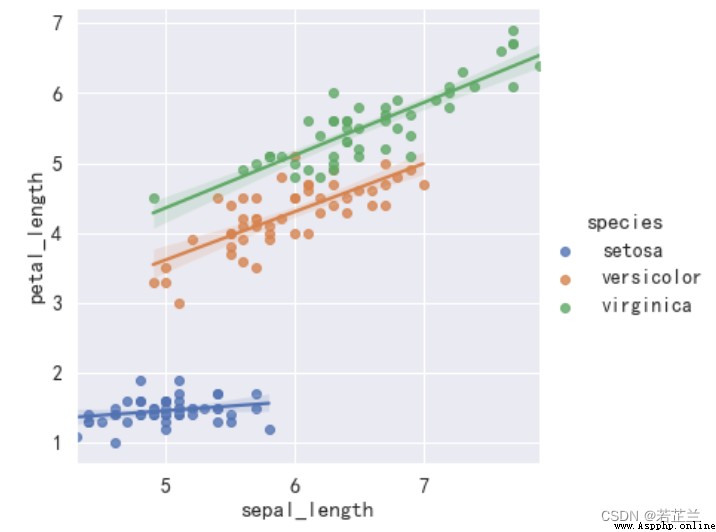
# 繪制回歸圖
import seaborn as sns
sns.lmplot(x="sepal_length", y="petal_length", hue="species", data=dataset)
plt.show()
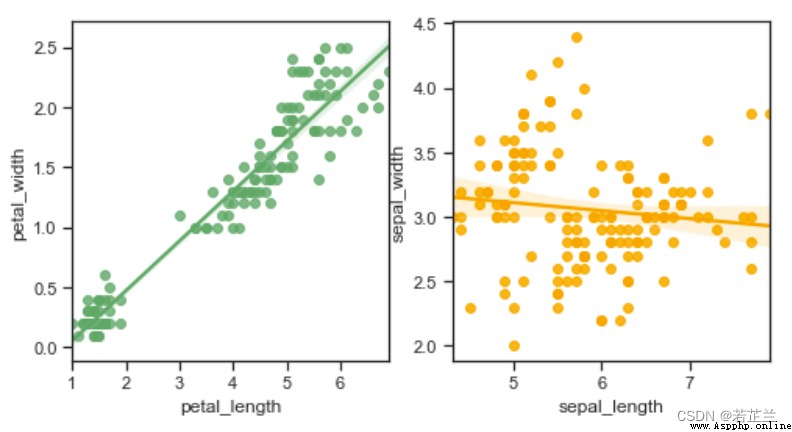
5. 回歸圖 – 使用regplot()函數
# 繪制線性回歸圖 -- 分別繪制
fig, axes = plt.subplots(1, 2, figsize=(8, 4))
sns.regplot(x="petal_length", y="petal_width", data=dataset, color="g", ax=axes[0])
sns.regplot(x="sepal_length", y="sepal_width", data=dataset, color="orange", ax=axes[1])
plt.show()
1. Joyplot() 函數的介紹
‘data:繪制數據集’
‘column’:使用datato plot the finite columns in
‘by=None’:分組列
‘gird=false:添加網格線
‘xlabelsize=none xThe size of the axis labels
‘ylabelsize=none yThe size of the axis labels
‘xrot=none xAxis tick label rotation angle
‘yrot=none yAxis tick label rotation angle
‘hist=flase顯示直方圖
‘fade=flase如果設定的是true,Gradient colors are displayed
‘ylim’=‘max共享y軸的刻度
ll=‘true The fill color under the curve
linecolor=‘None;曲線的顏色
blackground=none:背景顏色
overlap=1:Controls the degree of overlap
‘title’=none 添加圖表的標題
‘colormap=none 色譜