Matplotlib supports map data visualization in conjunction with the GADL and geopandas libraries.This article will show you how to visualize map data in real time.
The first step is to install the dependency library
If you are in a Linux system, you can install it directly:
pip install GDAL geopandas openpyxl fiona
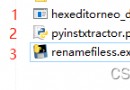
If in windows system, you need to:
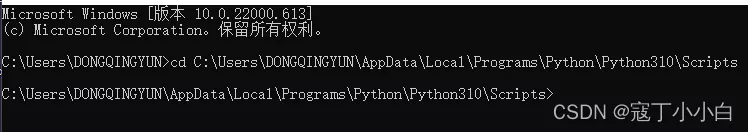
After the download is complete, execute
pip install xxx.whl
You can, and then install:
pip install geopandas openpyxl
The second step, import the dependent library
import matplotlib.pyplot as pltimport numpy as np