點擊這裡
networkx是Python的一個包,用於構建和操作復雜的圖結構,提供分析圖的算法.圖是由頂點、邊和可選的屬性構成的數據結構,頂點表示數據,邊是由兩個頂點唯一確定的,表示兩個頂點之間的關系.頂點和邊也可以擁有更多的屬性,以存儲更多的信息.
對於networkx創建的無向圖,允許一條邊的兩個頂點是相同的,即允許出現自循環,但是不允許兩個頂點之間存在多條邊,即出現平行邊.邊和頂點都可以有自定義的屬性,屬性稱作邊和頂點的數據,每一個屬性都是一個Key:Value對.
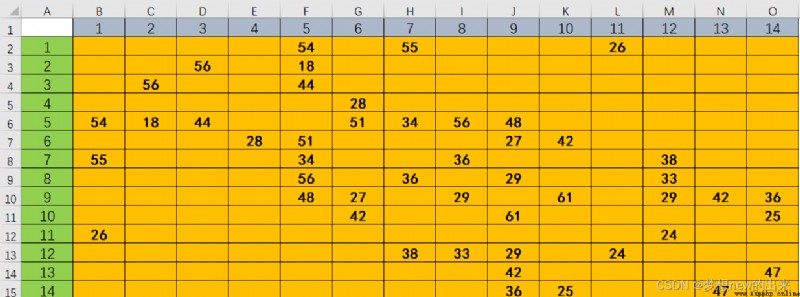
一、Visualize the data in this table as a graph
from matplotlib import pyplot as plt # 繪圖
import networkx as nx
import pandas as pd # 讀取exal文件
path=r'D:\date\python\study\saveLab\附件1.xlsx'
Then complete the initialization of the graph,use the tablepandas讀取為DataFrame
Convert table information to a dictionary,其中key為 邊集,Indicates edge information,value為 距離集合,represents the distance of the corresponding edge(權重weight)
Then there is the more crucial point,It's also a bit more detailed:
用draw方法繪制圖像,The parameter information here should be clarified
posWhat kind of layout is it in,一般有:
spectral_layout:根據圖的拉普拉斯特征向量排列節點
circular_layout:節點在一個圓環上均勻分布
random_layout:節點隨機分布
shell_layout:節點在同心圓上分布
spring_layout: 用Fruchterman-Reingold算法排列節點
這五種,Then specify the colorcolor,這裡也可以用 Colormap bar(cmap),Then specify the corresponding mapping parameters later(Take multiple colors 放置一個listas a mapping table),代碼中使用的是 隨機生成1,20范圍的隨機數 一共14次,因為一共14個點
plt.figure()
plt.subplot(111)
G = nx.Graph() # 建立一個空的無向圖G
DF = pd.read_excel(path)
DF.set_index(DF.columns[0], inplace=True)
DF.fillna(0, inplace=True)
ans = {
}
for i in range(1, DF.shape[0] + 1):
for j in range(1, DF.shape[1] + 1):
t = (i, j)
ans[t] = DF.loc[i, j]
for K in list(ans.keys()):
if ans[K] == 0:
ans.pop(K)
list(map(lambda e: G.add_edge(*e), list(ans.keys())))
pos = nx.spring_layout(G)
cm = plt.get_cmap('rainbow')
T=list(G.edges)
#fen
nx.draw_networkx_nodes(G, pos=pos, cmap=cm, node_color=[np.random.randint(1, 20) for _ in range(14)])
nx.draw_networkx_edges(G, pos=pos, edge_cmap=cm, edgelist=T,
edge_color=[np.random.randint(1, 10) for _ in range(24)])
nx.draw_networkx_labels(G, pos=pos)
# label_options = {"ec": "k", "fc": "white", "alpha": 0.5}
nx.draw_networkx_edge_labels(G, pos=pos, edge_labels=ans, rotate=0)
plt.show() # 顯示一個點Ea
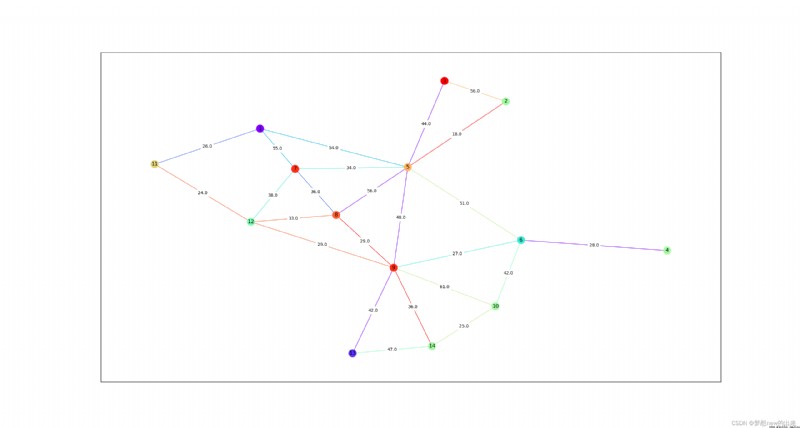
可視化如下所示:

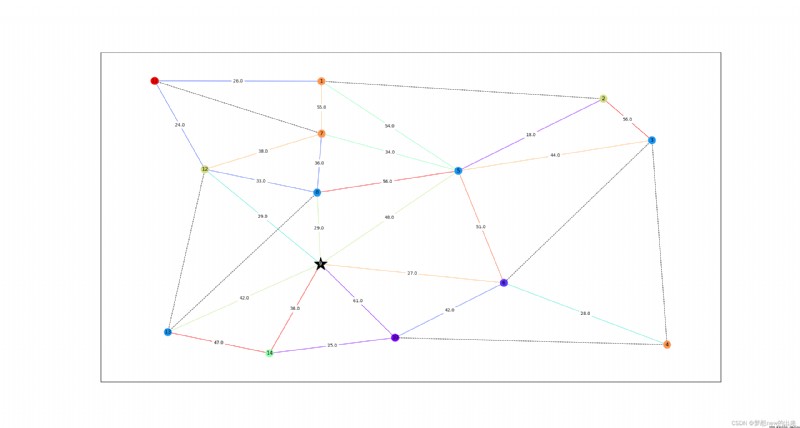
Connect some nodes with dotted lines,並且突出9號結點:
list(map(lambda e: G.add_edge(*e), list(ans.keys())))
---------------------------------The following is the code modification part--------------------------
E_list2 = [(1, 2), (3, 4), (3, 6), (4, 10), (7, 11), (8, 13), (12, 13)]
# list(map(lambda X: DEL(X), E_list2))
pos = nx.spring_layout(G)
cm = plt.get_cmap('rainbow')
T=list(G.edges)
T2=list(G.nodes)
T2.remove(9)
nx.draw_networkx_nodes(G, pos=pos, cmap=cm, nodelist=T2, node_color=[np.random.randint(1, 20) for _ in range(13)])
nx.draw_networkx_nodes(G, pos=pos, cmap=cm, nodelist=[9],node_color='black',node_size=1000,node_shape='*')
nx.draw_networkx_edges(G, pos=pos, edge_cmap=cm, edgelist=T,
edge_color=[np.random.randint(1, 10) for _ in range(24)])
nx.draw_networkx_edges(G, pos=pos, edge_color='black', edgelist=E_list2, style='--')
nx.draw_networkx_labels(G, pos=pos)
nx.draw_networkx_labels(G, pos=pos,labels={
9:'9'},font_color='white') #設置表
nx.draw_networkx_edge_labels(G, pos=pos, edge_labels=ans, rotate=0)
plt.show() # 顯示一個點Ea
time-=
These are mainly based on the above code with some modifications
寫在最後:
路漫漫其修遠兮,吾將上下而求索!伙伴們,明天見!