整理不易,希望各位看官大大隨手點個贊,各位的鼓勵是我不竭的學習動力。
在進行學習之前,我們需要先了解一個知識點:
RGB圖像,每個像素點值范圍為[0-255]
我們需要用到的數據集下載通道:
鏈接:https://pan.baidu.com/s/10EGibyqZKnIph-CHSnwx9Q
提取碼:6666
1.首先我們導入我們可能用到的包:
import matplotlib.pyplot as plt
from scipy.io import loadmat
from numpy import *
from IPython.display import Image
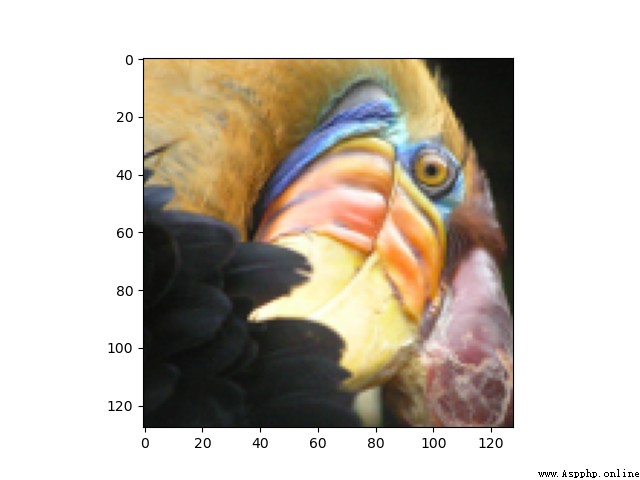
2.接下來我們導入相應的RGB圖像:
def load_picture():
path='./data/bird_small.png'
image=plt.imread(path)
plt.imshow(image)
plt.show()
我們看一下圖片:
注意:在這裡我們可能會遇到另一種導入的方法:
from IPython.display import display,Image
path='./data/bird_small.png'
display(Image(path))
但是值得一提的是,上面的方法在jupyter中可以正常實現,但是在Pycharm中是無法打開的,得到的結果為:
<IPython.core.display.Image object>
這裡不再贅述,具體的可以去看我之前的博客文章:
https://blog.csdn.net/wzk4869/article/details/126047821?spm=1001.2014.3001.5501
3.我們導入對應的數據集:
def load_data():
path='./data/bird_small.mat'
data=loadmat(path)
return data
這裡的數據集依舊是導入的mat格式,讀取方式和轉換方法在之前的博客中已經講解:
https://blog.csdn.net/wzk4869/article/details/126018725?spm=1001.2014.3001.5501
我們展示一下數據集:
data=load_data()
print(data.keys())
A=data['A']
print(A.shape)
dict_keys(['__header__', '__version__', '__globals__', 'A'])
(128, 128, 3)
是一個三維數組。
4.數據的歸一化:
這一步是相當有必要的,如果不進行,會報錯,具體的結果見我之前的博客文章:
https://blog.csdn.net/wzk4869/article/details/126060428?spm=1001.2014.3001.5501
我們歸一化的實現流程如下:
def normalizing(A):
A=A/255.
A_new=reshape(A,(-1,3))
return A_new
至於歸一化為什麼選擇除以255,不是減去均值除以標准差,原因也在下面的文章中講解。
https://blog.csdn.net/wzk4869/article/details/126060428?spm=1001.2014.3001.5501
我們看一下歸一化後的數據集:
[[0.85882353 0.70588235 0.40392157]
[0.90196078 0.7254902 0.45490196]
[0.88627451 0.72941176 0.43137255]
...
[0.25490196 0.16862745 0.15294118]
[0.22745098 0.14509804 0.14901961]
[0.20392157 0.15294118 0.13333333]]
(16384, 3)
這裡可以很明顯的看到,數據集均變為了0-1之間,並且把三維數組轉換成了二維數組。
A_new=reshape(A,(-1,3))這一步對於一部分小伙伴可能會感到吃力,不過沒關系,我在之前的博客中也有總結類似的reshape函數的用法,這裡不再贅述:
https://blog.csdn.net/wzk4869/article/details/126059912?spm=1001.2014.3001.5501
至此,我們數據集的處理過程已經結束,我們給出k-means算法,過程與之前相同。
5.k-means算法的實現
def get_near_cluster_centroids(X,centroids):
m = X.shape[0] #數據的行數
k = centroids.shape[0] #聚類中心的行數,即個數
idx = zeros(m) # 一維向量idx,大小為數據集中的點的個數,用於保存每一個X的數據點最小距離點的是哪個聚類中心
for i in range(m):
min_distance = 1000000
for j in range(k):
distance = sum((X[i, :] - centroids[j, :]) ** 2) # 計算數據點到聚類中心距離代價的公式,X中每個點都要和每個聚類中心計算
if distance < min_distance:
min_distance = distance
idx[i] = j # idx中索引為i,表示第i個X數據集中的數據點距離最近的聚類中心的索引
return idx # 返回的是X數據集中每個數據點距離最近的聚類中心
def compute_centroids(X, idx, k):
m, n = X.shape
centroids = zeros((k, n)) # 初始化為k行n列的二維數組,值均為0,k為聚類中心個數,n為數據列數
for i in range(k):
indices = where(idx == i) # 輸出的是索引位置
centroids[i, :] = (sum(X[indices, :], axis=1) / len(indices[0])).ravel()
return centroids
def k_means(A_1,initial_centroids,max_iters):
m,n=A_1.shape
k = initial_centroids.shape[0]
idx = zeros(m)
centroids = initial_centroids
for i in range(max_iters):
idx = get_near_cluster_centroids(A_1, centroids)
centroids = compute_centroids(A_1, idx, k)
return idx, centroids
def init_centroids(X, k):
m, n = X.shape
init_centroids = zeros((k, n))
idx = random.randint(0, m, k)
for i in range(k):
init_centroids[i, :] = X[idx[i], :]
return init_centroids
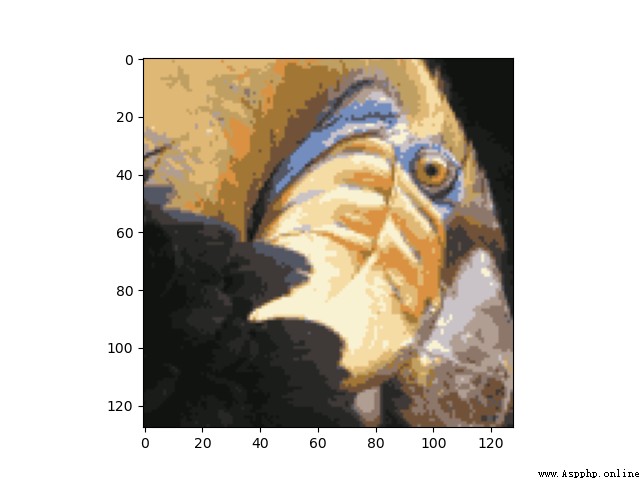
6.繪制壓縮後的圖像:
def reduce_picture():
initial_centroids = init_centroids(A_new, 16)
idx, centroids = k_means(A_new, initial_centroids, 10)
idx_1 = get_near_cluster_centroids(A_new, centroids)
A_recovered = centroids[idx_1.astype(int), :]
A_recovered_1 = reshape(A_recovered, (A.shape[0], A.shape[1], A.shape[2]))
plt.imshow(A_recovered_1)
plt.show()
我們結果為:
總結:雖然前後圖像不盡相同,但是我們經過聚類後的圖像明顯保留了原圖片的大部分特征,並且減少了內存空間。
import matplotlib.pyplot as plt
from scipy.io import loadmat
from numpy import *
from IPython.display import Image
def load_picture():
path='./data/bird_small.png'
image=plt.imread(path)
plt.imshow(image)
plt.show()
def load_data():
path='./data/bird_small.mat'
data=loadmat(path)
return data
def normalizing(A):
A=A/255.
A_new=reshape(A,(-1,3))
return A_new
def get_near_cluster_centroids(X,centroids):
m = X.shape[0] #數據的行數
k = centroids.shape[0] #聚類中心的行數,即個數
idx = zeros(m) # 一維向量idx,大小為數據集中的點的個數,用於保存每一個X的數據點最小距離點的是哪個聚類中心
for i in range(m):
min_distance = 1000000
for j in range(k):
distance = sum((X[i, :] - centroids[j, :]) ** 2) # 計算數據點到聚類中心距離代價的公式,X中每個點都要和每個聚類中心計算
if distance < min_distance:
min_distance = distance
idx[i] = j # idx中索引為i,表示第i個X數據集中的數據點距離最近的聚類中心的索引
return idx # 返回的是X數據集中每個數據點距離最近的聚類中心
def compute_centroids(X, idx, k):
m, n = X.shape
centroids = zeros((k, n)) # 初始化為k行n列的二維數組,值均為0,k為聚類中心個數,n為數據列數
for i in range(k):
indices = where(idx == i) # 輸出的是索引位置
centroids[i, :] = (sum(X[indices, :], axis=1) / len(indices[0])).ravel()
return centroids
def k_means(A_1,initial_centroids,max_iters):
m,n=A_1.shape
k = initial_centroids.shape[0]
idx = zeros(m)
centroids = initial_centroids
for i in range(max_iters):
idx = get_near_cluster_centroids(A_1, centroids)
centroids = compute_centroids(A_1, idx, k)
return idx, centroids
def init_centroids(X, k):
m, n = X.shape
init_centroids = zeros((k, n))
idx = random.randint(0, m, k)
for i in range(k):
init_centroids[i, :] = X[idx[i], :]
return init_centroids
def reduce_picture():
initial_centroids = init_centroids(A_new, 16)
idx, centroids = k_means(A_new, initial_centroids, 10)
idx_1 = get_near_cluster_centroids(A_new, centroids)
A_recovered = centroids[idx_1.astype(int), :]
A_recovered_1 = reshape(A_recovered, (A.shape[0], A.shape[1], A.shape[2]))
plt.imshow(A_recovered_1)
plt.show()
if __name__=='__main__':
load_picture()
data=load_data()
print(data.keys())
A=data['A']
print(A.shape)
A_new=normalizing(A)
print(A_new)
print(A_new.shape)
reduce_picture()