整理不易,I hope that all the viewers will give a big thumbs up,Your encouragement is my inexhaustible motivation for learning.
在進行學習之前,We need to understand a knowledge point first:
RGB圖像,The value range of each pixel is [0-255]
The dataset download channel we need to use:
鏈接:https://pan.baidu.com/s/10EGibyqZKnIph-CHSnwx9Q
提取碼:6666
1.First we import the packages we might use:
import matplotlib.pyplot as plt
from scipy.io import loadmat
from numpy import *
from IPython.display import Image
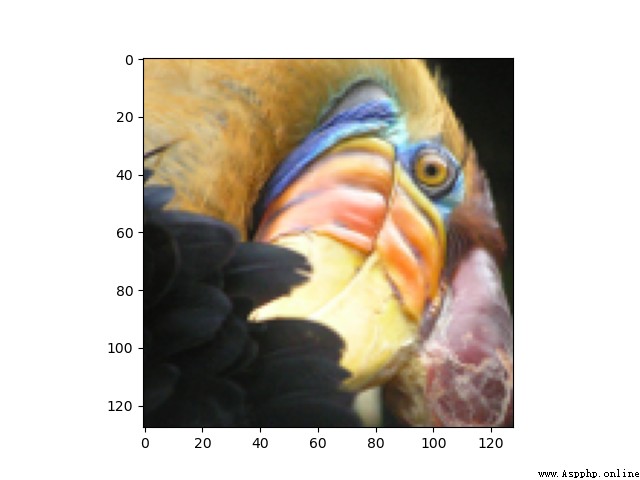
2.Next we import the corresponding RGB圖像:
def load_picture():
path='./data/bird_small.png'
image=plt.imread(path)
plt.imshow(image)
plt.show()
我們看一下圖片:
注意:Here we may encounter another method of importing:
from IPython.display import display,Image
path='./data/bird_small.png'
display(Image(path))
但是值得一提的是,上面的方法在jupyter中可以正常實現,但是在Pycharmcannot be opened,得到的結果為:
<IPython.core.display.Image object>
這裡不再贅述,See my previous blog post for details:
https://blog.csdn.net/wzk4869/article/details/126047821?spm=1001.2014.3001.5501
3.We import the corresponding dataset:
def load_data():
path='./data/bird_small.mat'
data=loadmat(path)
return data
The dataset here is still importedmat格式,The reading method and conversion method have been explained in the previous blog:
https://blog.csdn.net/wzk4869/article/details/126018725?spm=1001.2014.3001.5501
Let's show the dataset:
data=load_data()
print(data.keys())
A=data['A']
print(A.shape)
dict_keys(['__header__', '__version__', '__globals__', 'A'])
(128, 128, 3)
是一個三維數組.
4.數據的歸一化:
This step is quite necessary,如果不進行,會報錯,See my previous blog post for specific results:
https://blog.csdn.net/wzk4869/article/details/126060428?spm=1001.2014.3001.5501
Our normalized implementation process is as follows:
def normalizing(A):
A=A/255.
A_new=reshape(A,(-1,3))
return A_new
As for normalization, why choose to divide by255,Not subtract the mean divided by the standard deviation,The reason is also explained in the following article.
https://blog.csdn.net/wzk4869/article/details/126060428?spm=1001.2014.3001.5501
Let's look at the normalized dataset:
[[0.85882353 0.70588235 0.40392157]
[0.90196078 0.7254902 0.45490196]
[0.88627451 0.72941176 0.43137255]
...
[0.25490196 0.16862745 0.15294118]
[0.22745098 0.14509804 0.14901961]
[0.20392157 0.15294118 0.13333333]]
(16384, 3)
這裡可以很明顯的看到,The datasets have all changed0-1之間,And convert the three-dimensional array into a two-dimensional array.
A_new=reshape(A,(-1,3))This step may be difficult for some friends,不過沒關系,I have summarized similar in my previous blogreshape函數的用法,這裡不再贅述:
https://blog.csdn.net/wzk4869/article/details/126059912?spm=1001.2014.3001.5501
至此,The processing of our dataset has ended,我們給出k-means算法,The process is the same as before.
5.k-means算法的實現
def get_near_cluster_centroids(X,centroids):
m = X.shape[0] #數據的行數
k = centroids.shape[0] #聚類中心的行數,即個數
idx = zeros(m) # 一維向量idx,大小為數據集中的點的個數,用於保存每一個X的數據點最小距離點的是哪個聚類中心
for i in range(m):
min_distance = 1000000
for j in range(k):
distance = sum((X[i, :] - centroids[j, :]) ** 2) # 計算數據點到聚類中心距離代價的公式,X中每個點都要和每個聚類中心計算
if distance < min_distance:
min_distance = distance
idx[i] = j # idx中索引為i,表示第i個X數據集中的數據點距離最近的聚類中心的索引
return idx # 返回的是X數據集中每個數據點距離最近的聚類中心
def compute_centroids(X, idx, k):
m, n = X.shape
centroids = zeros((k, n)) # 初始化為k行n列的二維數組,值均為0,k為聚類中心個數,n為數據列數
for i in range(k):
indices = where(idx == i) # 輸出的是索引位置
centroids[i, :] = (sum(X[indices, :], axis=1) / len(indices[0])).ravel()
return centroids
def k_means(A_1,initial_centroids,max_iters):
m,n=A_1.shape
k = initial_centroids.shape[0]
idx = zeros(m)
centroids = initial_centroids
for i in range(max_iters):
idx = get_near_cluster_centroids(A_1, centroids)
centroids = compute_centroids(A_1, idx, k)
return idx, centroids
def init_centroids(X, k):
m, n = X.shape
init_centroids = zeros((k, n))
idx = random.randint(0, m, k)
for i in range(k):
init_centroids[i, :] = X[idx[i], :]
return init_centroids
6.Draw the compressed image:
def reduce_picture():
initial_centroids = init_centroids(A_new, 16)
idx, centroids = k_means(A_new, initial_centroids, 10)
idx_1 = get_near_cluster_centroids(A_new, centroids)
A_recovered = centroids[idx_1.astype(int), :]
A_recovered_1 = reshape(A_recovered, (A.shape[0], A.shape[1], A.shape[2]))
plt.imshow(A_recovered_1)
plt.show()
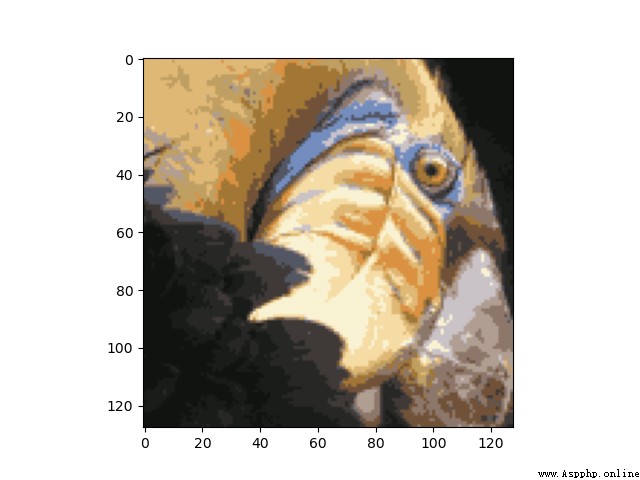
我們結果為:
總結:Although the before and after images are not the same,But our clustered image obviously retains most of the features of the original image,And reduce the memory space.
import matplotlib.pyplot as plt
from scipy.io import loadmat
from numpy import *
from IPython.display import Image
def load_picture():
path='./data/bird_small.png'
image=plt.imread(path)
plt.imshow(image)
plt.show()
def load_data():
path='./data/bird_small.mat'
data=loadmat(path)
return data
def normalizing(A):
A=A/255.
A_new=reshape(A,(-1,3))
return A_new
def get_near_cluster_centroids(X,centroids):
m = X.shape[0] #數據的行數
k = centroids.shape[0] #聚類中心的行數,即個數
idx = zeros(m) # 一維向量idx,大小為數據集中的點的個數,用於保存每一個X的數據點最小距離點的是哪個聚類中心
for i in range(m):
min_distance = 1000000
for j in range(k):
distance = sum((X[i, :] - centroids[j, :]) ** 2) # 計算數據點到聚類中心距離代價的公式,X中每個點都要和每個聚類中心計算
if distance < min_distance:
min_distance = distance
idx[i] = j # idx中索引為i,表示第i個X數據集中的數據點距離最近的聚類中心的索引
return idx # 返回的是X數據集中每個數據點距離最近的聚類中心
def compute_centroids(X, idx, k):
m, n = X.shape
centroids = zeros((k, n)) # 初始化為k行n列的二維數組,值均為0,k為聚類中心個數,n為數據列數
for i in range(k):
indices = where(idx == i) # 輸出的是索引位置
centroids[i, :] = (sum(X[indices, :], axis=1) / len(indices[0])).ravel()
return centroids
def k_means(A_1,initial_centroids,max_iters):
m,n=A_1.shape
k = initial_centroids.shape[0]
idx = zeros(m)
centroids = initial_centroids
for i in range(max_iters):
idx = get_near_cluster_centroids(A_1, centroids)
centroids = compute_centroids(A_1, idx, k)
return idx, centroids
def init_centroids(X, k):
m, n = X.shape
init_centroids = zeros((k, n))
idx = random.randint(0, m, k)
for i in range(k):
init_centroids[i, :] = X[idx[i], :]
return init_centroids
def reduce_picture():
initial_centroids = init_centroids(A_new, 16)
idx, centroids = k_means(A_new, initial_centroids, 10)
idx_1 = get_near_cluster_centroids(A_new, centroids)
A_recovered = centroids[idx_1.astype(int), :]
A_recovered_1 = reshape(A_recovered, (A.shape[0], A.shape[1], A.shape[2]))
plt.imshow(A_recovered_1)
plt.show()
if __name__=='__main__':
load_picture()
data=load_data()
print(data.keys())
A=data['A']
print(A.shape)
A_new=normalizing(A)
print(A_new)
print(A_new.shape)
reduce_picture()