Preface
Data visualization is the most important part of our data analysis , Charts can turn complexity into simplicity , To abstract into concrete , Make it easier for readers or listeners to understand . Data is visualized as charts , It can make the data more intuitive , More at your fingertips , Enable enterprises to more quickly , Make business decisions more accurately . So that enterprises can better make achievements in their fields . Even in an invincible position . I learned before pyecharts Drawing library of , Its strength shocked me , But the best drawing library is just a form of front-end , Data is the most important object of data analysis , Before 《Python Draw exquisite visual data analysis charts ( Two )-pyecharts》 All the data of are created manually , This obviously does not meet our daily development needs , Do data analysis , There is often a lot of data to sort out , More data , The conclusion will be more accurate . So our data will come from different channels . Will be stored in different types of files . Our usual data usually comes from Excel,csv,TXT,json wait .Excel It is the most commonly used data storage medium . If the data is meters , Then these storage media are granaries . and Pandas It is one of the best data processing libraries used in combination with these file media ,Pandas Is a powerful tool set for analyzing structured data , It can operate on various data , Like merging 、 Reshaping 、 choice , There are also data cleaning and data processing features . Widely used in academic 、 Finance 、 Statistics and other data analysis fields .
Get ready
install pyecharts and Pandas
pip install pandas
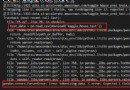
pip install pyecharts Default installation complies with Python The latest version of version You can check the installed version through the code
import pyecharts
import pandas
print(pyecharts.__version__)
print(pandas.__version__)
Running results :
1.9.1
1.0.5
pyecharts combination pandas Draw a line chart of weekly sales
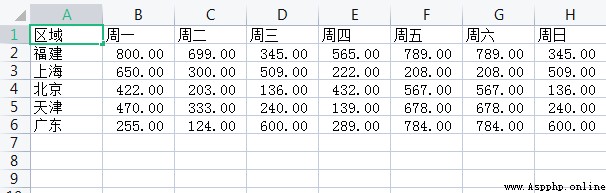
In the example Excel data :
The first step, of course, is to import Python library , Import pyecharts and pandas
from pyecharts.charts import Line
from pyecharts import options as opts
import pandas as pd
Use pandas Import excel Data in the table
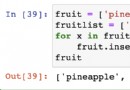
df = pd.read_excel(r'data.xlsx') Transpose the data , Let the data become a format suitable for our needs
df2 = pd.DataFrame(df.values.T, index=df.columns, columns=df.index)# Transposition 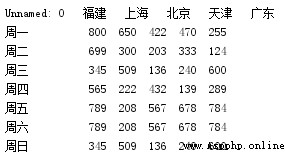
Processing data : Put the data mode separately into the corresponding list Create three list To store data
indexs = [] #  Row index
columns = [] #  Column index
data = [] #  Data for each column , 2 d list
Use for Loop through the data
# obtain X Axis variable
for index in df2.index:
 indexs.append(index)

# Get the index of each row
for column in df2.columns:
 columns.append(column)

# Put each row of data into one list
for i in range(0,len(columns)):
 data_ = []
 for j in df2.iloc[:,i]:
 data_.append(j)
 data.append(data_)
Data processing results :

It involves multiple broken line displays , Use cascading multi graph functions overlap() To deal with it ,overlap() Multiple graphs can be displayed in the same chart at the same time , It can not only stack the same type, but also stack multiple types of graphics , such as : Histogram and line chart Create a xiaoshou() function :
def xiaoshou() -> Line: First set the basic configuration
c = (
Line()
.add_xaxis(indexs[1:])
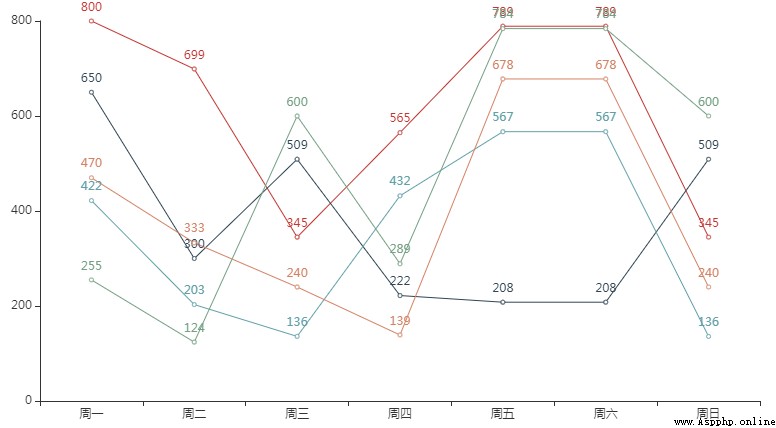
.set_global_opts(title_opts=opts.TitleOpts(title=" Weekly sales in all regions "))
) loop data List and chart , No matter how many rows and columns of data are added later, it can be adaptive
 for i in range(0,len(columns)):
 c_ = (
 Line()
 .add_xaxis(indexs[1:])
 .add_yaxis(data[i][0], data[i][1:])
 )
 c.overlap(c_) #  The stack
 return c
Then unified rendering
xiaoshou().render() Final effect :
summary
Use for Cycle the data and put it into pyecharts Render and draw charts , It can well adapt to the deletion of table data