be based on Python Realization ID3 Algorithm Demo video
Catalog
One 、 Homework tasks
Two 、 Running environment
3、 ... and 、 Algorithm is introduced
Four 、 Program analysis
Make datasets :
Output decision tree results
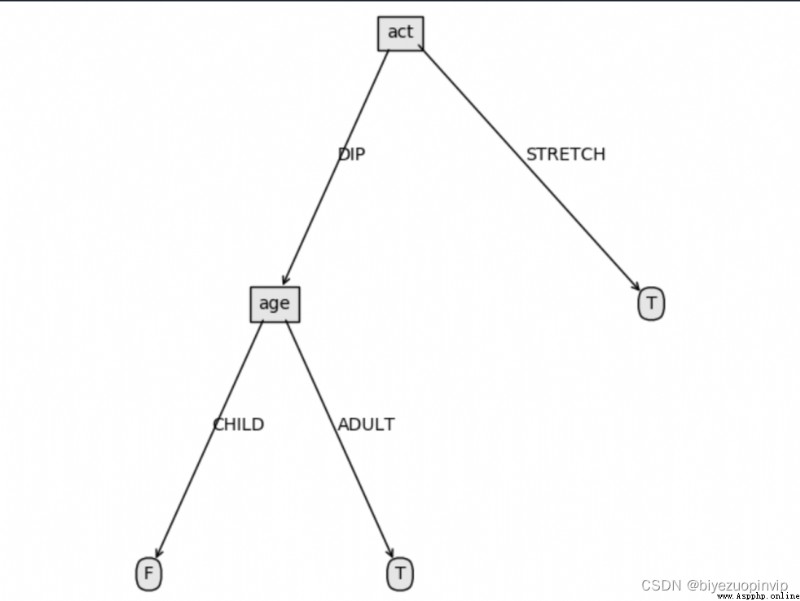
Visual decision tree :
5、 ... and 、 Interface screenshot and analysis
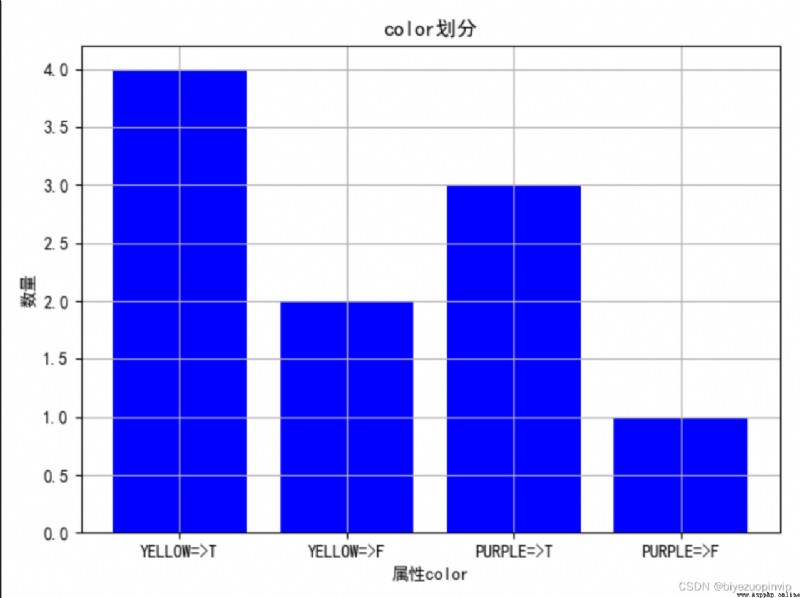
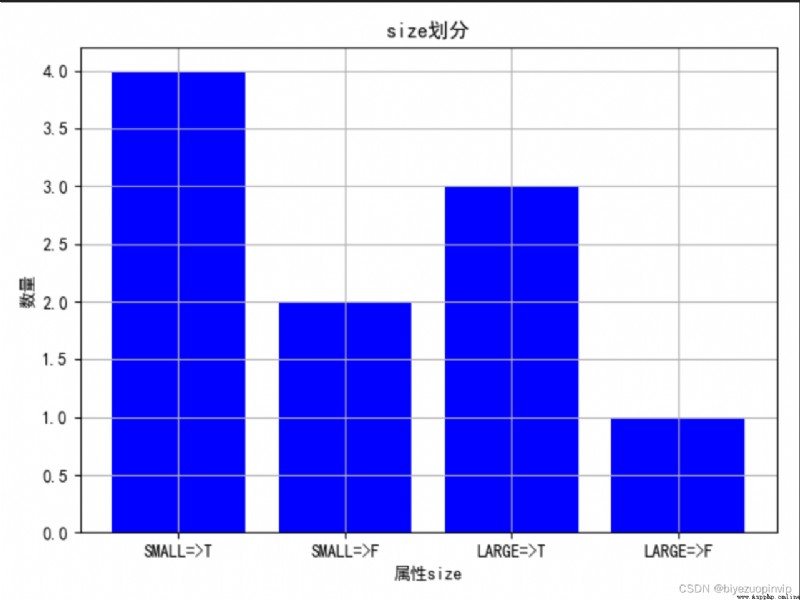
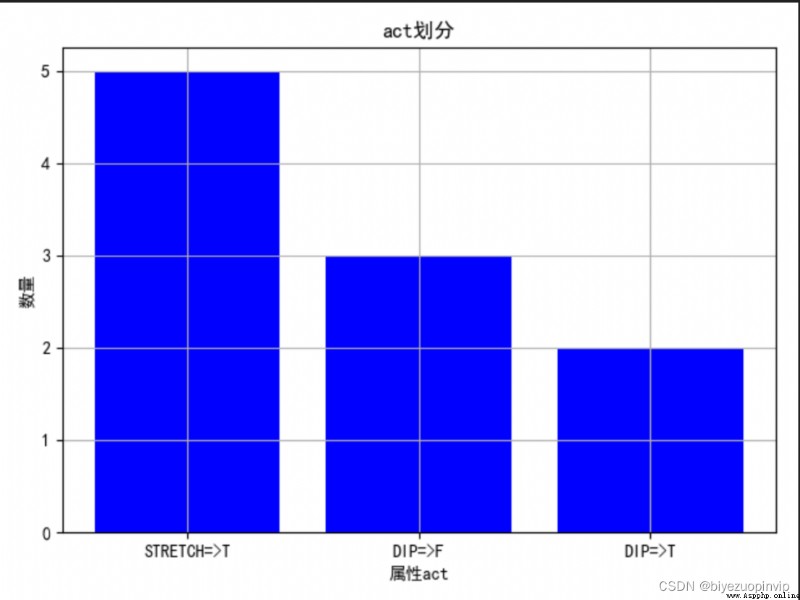
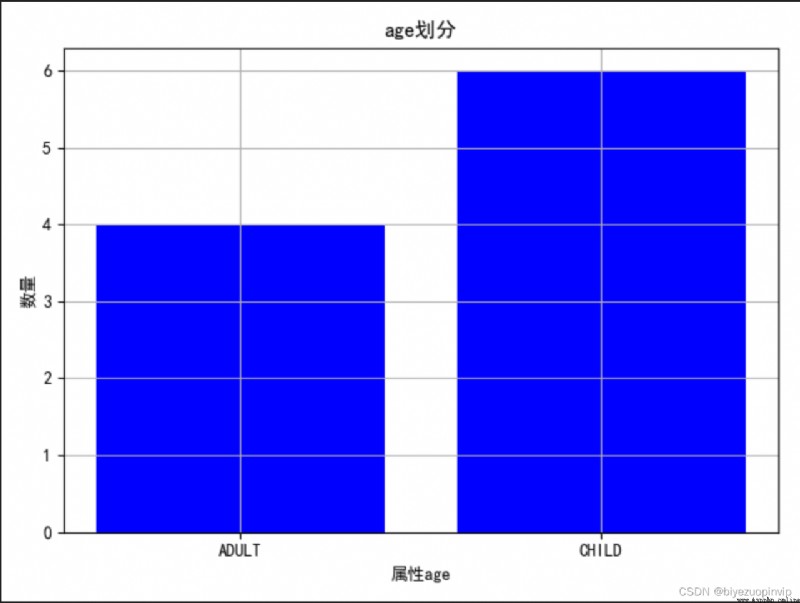
1. Observe the division of different attributes through the diagram :
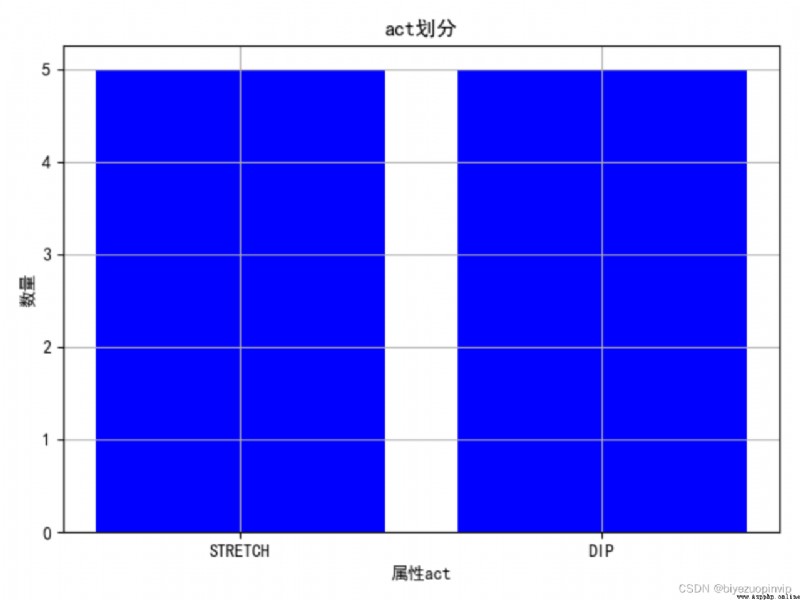
2. View the influence of attributes on the division of results :
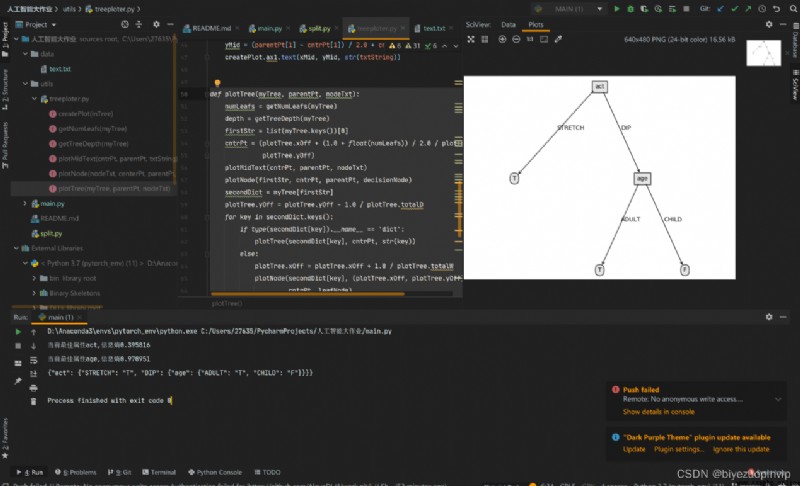
3. Program running console output results :
4. Decision tree visualization results :
6、 ... and 、 Experience
7、 ... and 、 Reference material
8、 ... and 、 appendix
Code
One 、 Homework tasks
1. Programming to realize ID3 Algorithm , For the data in the following table , Generate decision tree .
Tips : Data file format can be designed , Such as color Property value YELLOW:0,PURPLE:1 etc. , The program reads the training set data from the specified data file .
Problems develop : It is required to demonstrate the process of calculating the gain of attribute information and the process of generating decision tree .
Two 、 Running environment
programing language :Python
Using third party libraries :Numpy,Matplotlib,Scikit-learn
IDE:PyCharm
operating system :WIndows10
Decision tree (decision tree) It's a tree structure ( It can be a binary tree or a non binary tree ). Each of its non leaf nodes represents a test on a feature attribute , Each branch represents the output of the feature property in a codomain , Each leaf node stores a category . The process of making decisions with a decision tree starts at the root node , Test the corresponding feature properties in the item to be classified , And select the output branch by its value , Until you reach the leaf node , Take the category of leaf nodes as the result of the decision . quote 《 machine learning 》( Watermelon book ) Examples in :
Reprinted from :http://www.biyezuopin.vip/onews.asp?id=16531
from math import log
import operator # This line is added at the top of the file
import json
from utils.treeploter import *
# Calculate entropy of information
def calcShannonEnt(dataSet):
numEntries = len(dataSet) # Sample size
labelCounts = {
}
for featVec in dataSet: # Traverse each sample
currentLabel = featVec[-1] # Category of the current sample
if currentLabel not in labelCounts.keys(): # Generating a category Dictionary
labelCounts[currentLabel] = 0
labelCounts[currentLabel] += 1
shannonEnt = 0.0
for key in labelCounts.keys(): # Calculate entropy of information
prob = float(labelCounts[key]) / numEntries
shannonEnt = shannonEnt - prob * log(prob, 2)
# print(" attribute %s The entropy of information is %f"%(key,shannonEnt))
return shannonEnt
# Divide the data set ,axis: According to the number of attributes ,value: The attribute value corresponding to the subset to be returned
def splitDataSet(dataSet, axis, value):
retDataSet = []
featVec = []
for featVec in dataSet:
if featVec[axis] == value:
reducedFeatVec = featVec[:axis]
reducedFeatVec.extend(featVec[axis + 1:])
retDataSet.append(reducedFeatVec)
return retDataSet
# Choose the best way to partition data sets
def chooseBestFeatureToSplit(dataSet):
numFeatures = len(dataSet[0]) - 1 # Number of attributes
baseEntropy = calcShannonEnt(dataSet)
bestInfoGain = 0.0
bestFeature = -1
for i in range(numFeatures): # Gain technical information for each attribute
featList = [example[i] for example in dataSet]
uniqueVals = set(featList) # The value collection of this attribute
newEntropy = 0.0
for value in uniqueVals: # Calculate the information gain for each value
subDataSet = splitDataSet(dataSet, i, value)
prob = len(subDataSet) / float(len(dataSet))
newEntropy += prob * calcShannonEnt(subDataSet)
infoGain = baseEntropy - newEntropy
if (infoGain > bestInfoGain): # Select the attribute with the most information gain
bestInfoGain = infoGain
bestFeature = i
return bestFeature,bestInfoGain
# Return the category with the most occurrences by sorting
def majorityCnt(classList):
classCount = {
}
for vote in classList:
if vote not in classCount.keys(): classCount[vote] = 0
classCount[vote] += 1
sortedClassCount = sorted(classCount.iteritems(),
key=operator.itemgetter(1), reverse=True)
return sortedClassCount[0][0]
# Recursively build the decision tree
def createTree(dataSet, labels):
classList = [example[-1] for example in dataSet] # Category vector
if classList.count(classList[0]) == len(classList): # If there is only one category , return
return classList[0]
if len(dataSet[0]) == 1: # If all the features are traversed , Returns the category with the most occurrences
return majorityCnt(classList)
bestFeat,bestGain = chooseBestFeatureToSplit(dataSet) # Index of optimal partition attributes
bestFeatLabel = labels[bestFeat] # Label of optimal partition attribute
print(" Current best attribute %s, Information entropy %f" % (bestFeatLabel,bestGain))
myTree = {
bestFeatLabel: {
}}
del (labels[bestFeat]) # The selected features are no longer involved in classification
featValues = [example[bestFeat] for example in dataSet]
uniqueValue = set(featValues) # All possible values of this attribute , That is, the branch of the node
for value in uniqueValue: # For each branch , Recursive tree building
subLabels = labels[:]
myTree[bestFeatLabel][value] = createTree(
splitDataSet(dataSet, bestFeat, value), subLabels)
return myTree
if __name__ == '__main__':
fr = open(r'data/text.txt')
listWm = [inst.strip().split(',')[1:] for inst in fr.readlines()[1:]]
# print(listWm)
fr.close()
fr = open(r'data/text.txt')
labels = fr.readlines()[0].split(',')[1:]
Trees = createTree(listWm, labels)
fr.close()
print(json.dumps(Trees, ensure_ascii=False))
createPlot(Trees)
