
We are applying Python Conduct Data analysis mining and machine learning when , The most commonly used tool library is Pandas, It can help us process and analyze data quickly .

Yes Pandas Unfamiliar students , Be sure to learn this treasure tool library !ShowMeAI I gave you a detailed tutorial , Can be in Python Data analysis tutorial View in , We also made Pandas Quick reference table , It is convenient for everyone to quickly find the required functions . If you like learning with videos , The recommended B Stand here Quick combat tutorial .
But in the use of Pandas when , We often encounter problems like the following , It affects us to check the data for details .
For very long fields, the display may be incomplete , As shown in the figure below ,URL Shortened display .

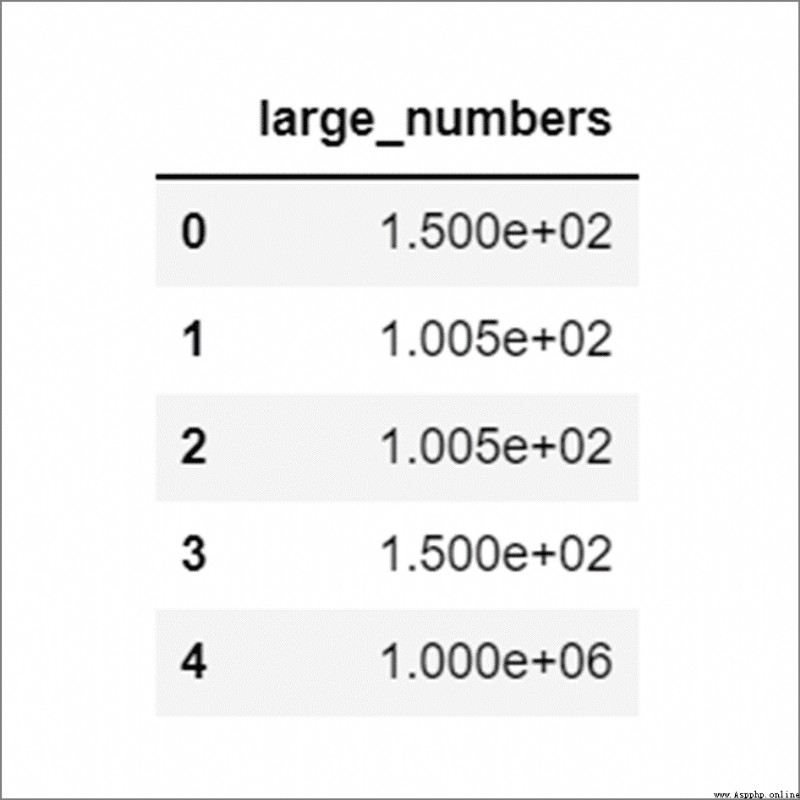
Pandas By default 『 Scientific enumeration 』 Show large floating point numbers , for example 1000000.5 Is shown as 1.000e+06 . For large numbers , There may be the following display , As a result, we cannot see the specific value .
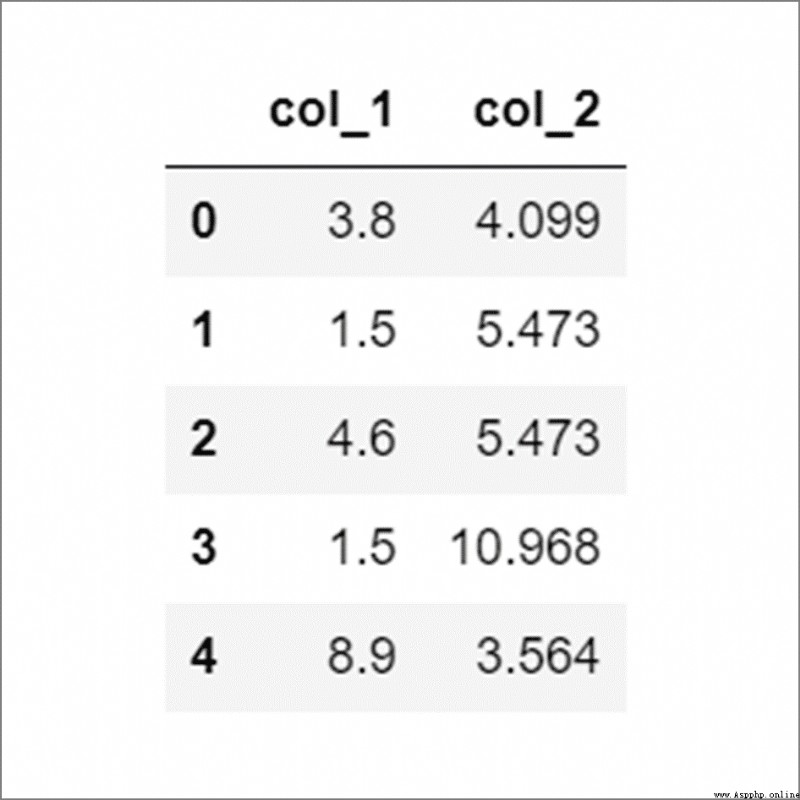
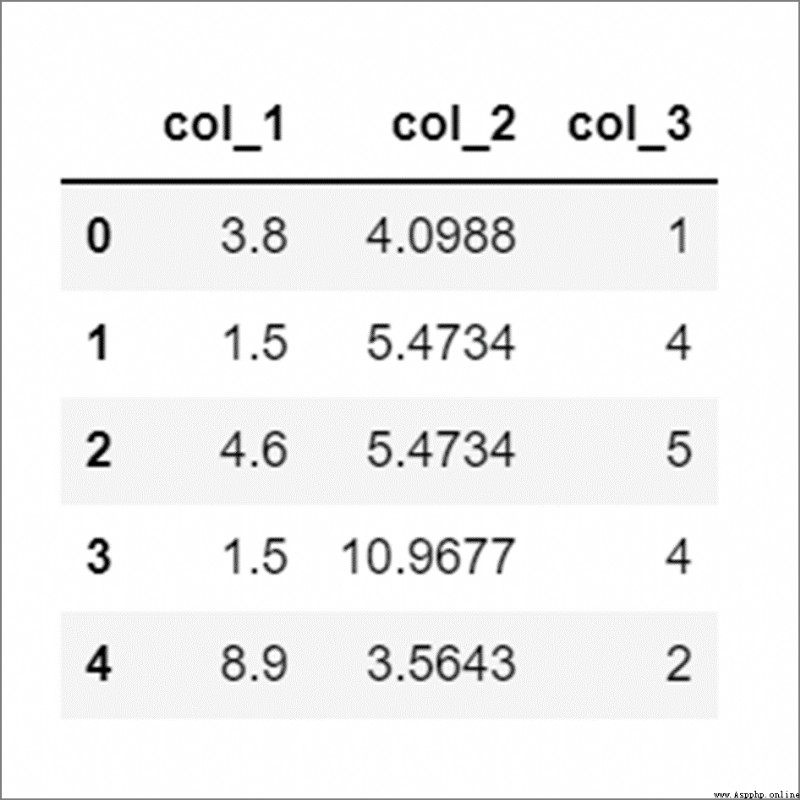
For floating-point field columns ,Pandas There may be different bit precision . For example, in the figure below ,col_1 To one decimal place , and col_2 Accurate to three decimal places . Sometimes there may be information differences due to inconsistent accuracy .
In this article ,ShowMeAI How to use Pandas Customize settings to solve problems such as the above . The main settings include the following :
Be careful : The above settings only change the display and presentation of data , Actually, it will not affect Dataframe Stored data .

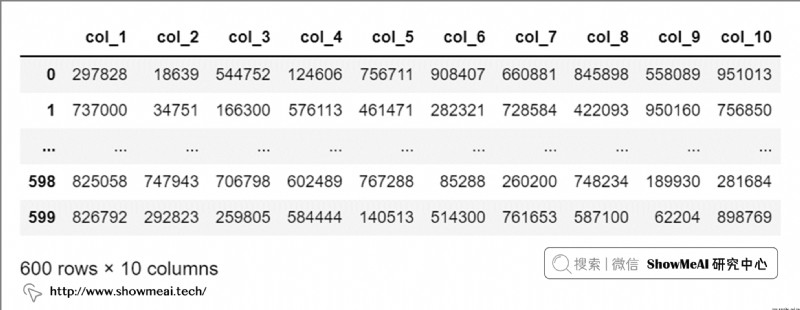
Print big Dataframe( Data with a large number of rows and columns ) when ,Pandas Before default display 5 After the row and 5 That's ok , As shown in the figure below .
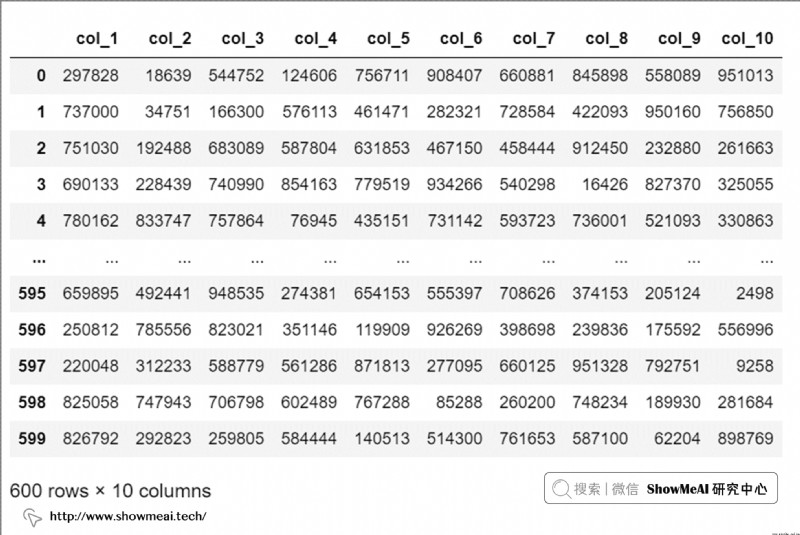
We can set the display options display.max_rows To change the number of rows to display , For example, we set it to 4.
pd.set_option("diaply.max_row", 4)
df
We can use the reset option pd.reset_option("display.max_rows") Restore the default row count display setting .
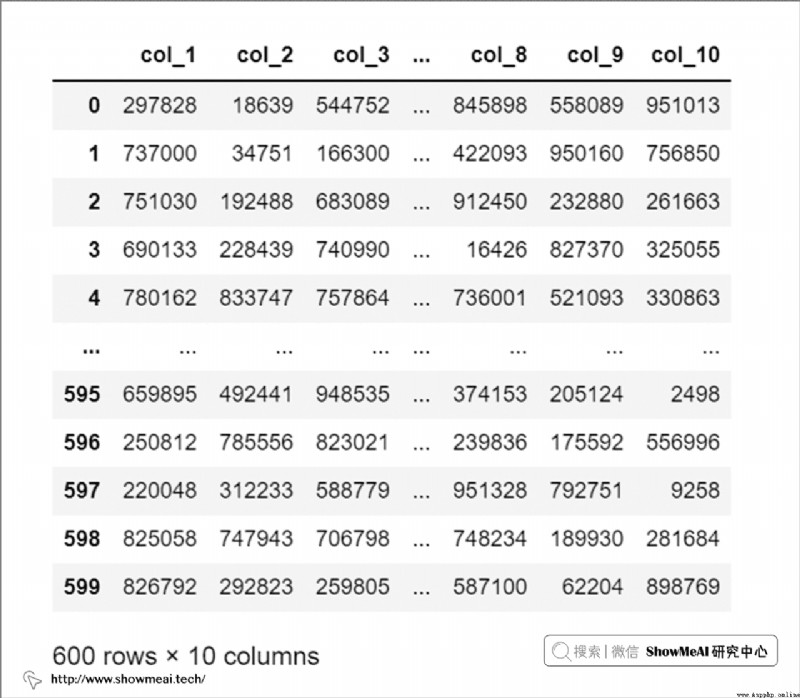
Same thing , We can set display.max_columns Custom output Dataframe The number of columns to display .
pd.set_option("diaply.max_columns", 6)
df
We can even set pd.set_option('display.max_columns',`` ``None) To display all columns ( But you need to pay attention to memory usage , This operation may make Jupyter Notebook It takes up a lot of resources ).
We can also use it pd.reset_option("display.max_columns") Reset returns to the default settings .
In the following illustration , We can't see the full text of the first two lines , Because their characters are too long ( It's longer than 50).

We set up display.max_colwidth To adjust to 70, You can see the full text , As shown in the figure below .
pd.set_option("diaply.max_colwidth", 70)
df

The operation of resetting this setting is still pd.reset_option("display.max_colwidth").
In the previous example ,col_1 and col_2 The decimal precision of is inconsistent :
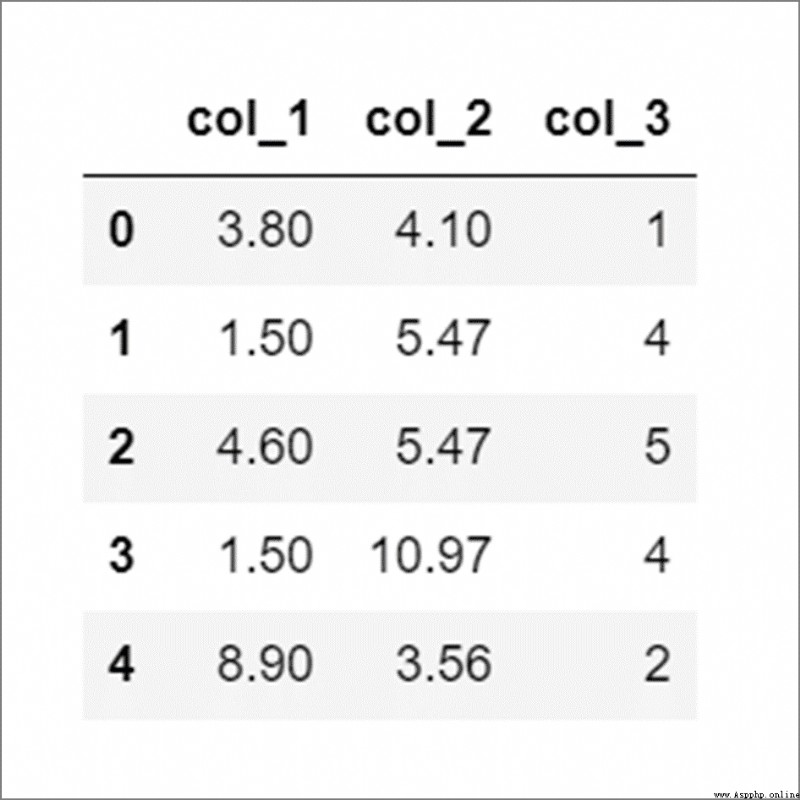
We can set display.float_format to "{:.2f}".format Make the format consistent , As shown in the figure below .
This option only affects floating-point columns , Without affecting the integer column .
pd.set_option("diaply.float_format", "{:.2f}".format)
df
The operation of resetting this setting is pd.reset_option("display.float_format")
Pandas By default, large floating-point values are displayed in scientific counting .
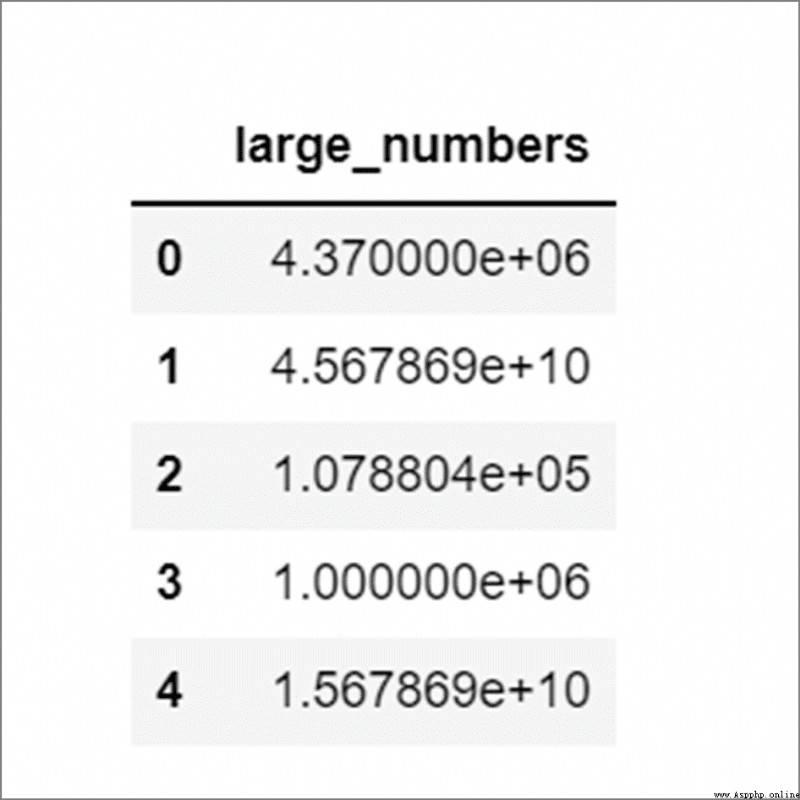
By setting display.float_format to "{:,.2f}".format, We can add delimiters for thousands .
pd.set_option("diaply.float_format", "{:,.2f}".format)
df
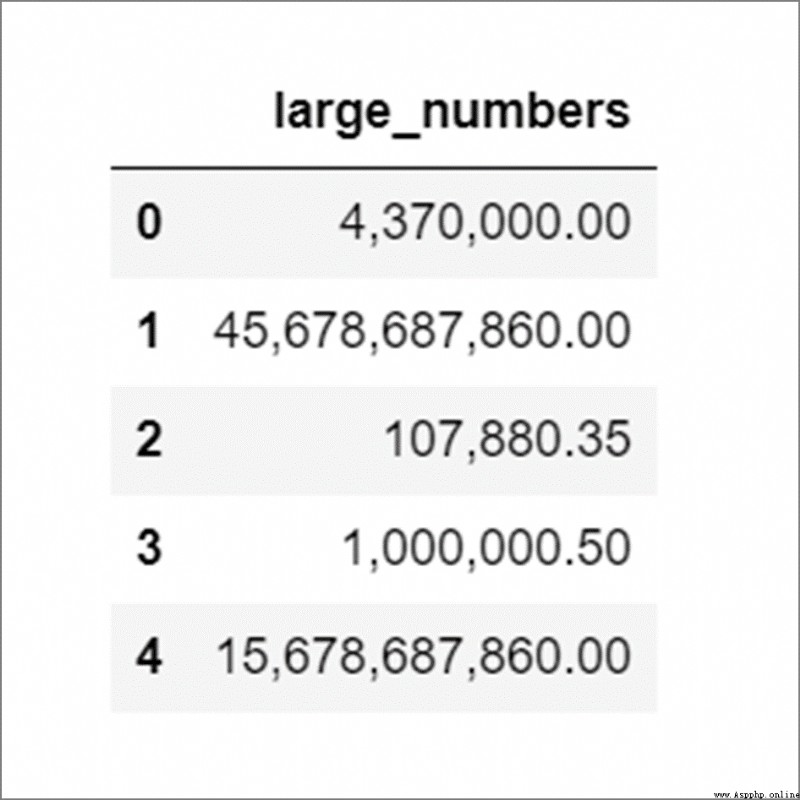
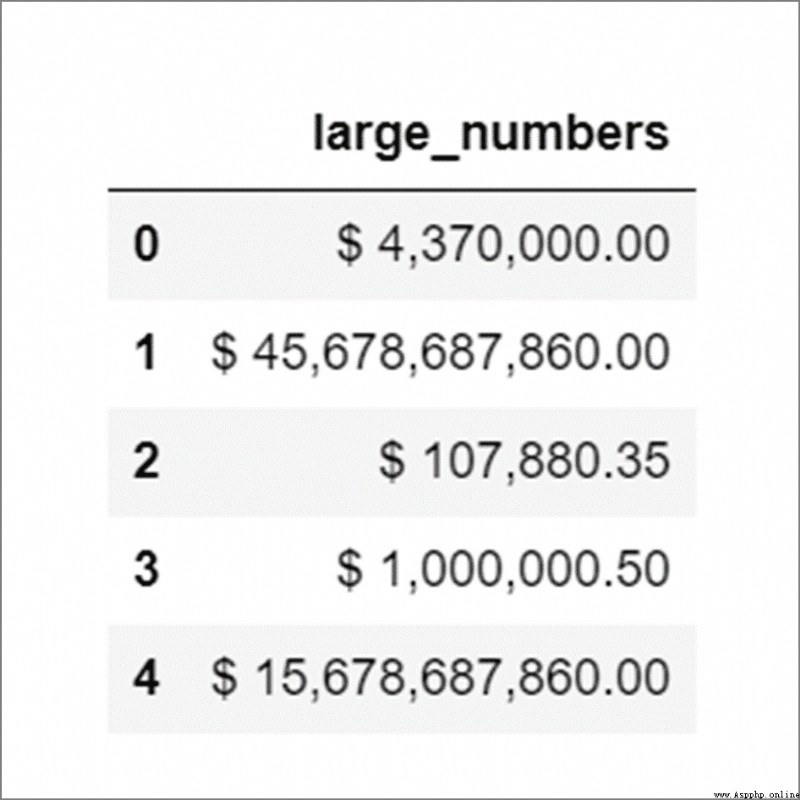
We can even add currency symbols in front of numerical values , For example, we put display.float_format Set to "$ {:,.2f}".format, The results are as follows :
pd.set_option("diaply.float_format", "$ {:,.2f}".format)
df
Listed above are some of the most commonly used settings , If we can't remember the names of these settings , Or we want to know all the display settings that can be adjusted , What can I do ? In fact, you can use pd.describe_option() Get a list of all available display settings .
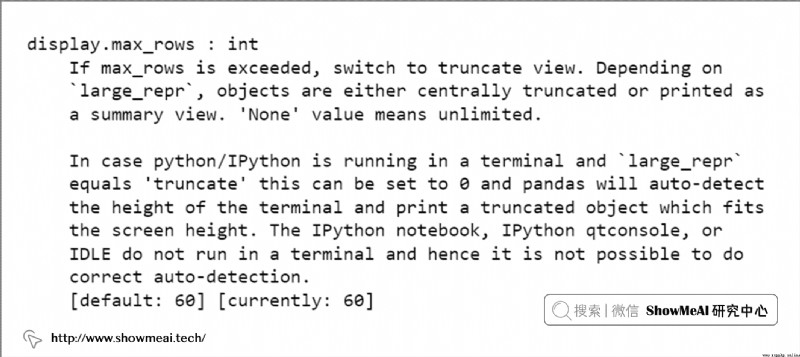
For a specific display setting , Can be in pd.describe_option() Pass in the name of the display setting you want to adjust to get the usage details , For example, we run pd.describe_option("max_rows") The description will be printed display.max_rows Use details , As shown in the figure below .
pd.describe_option("max_rows")
