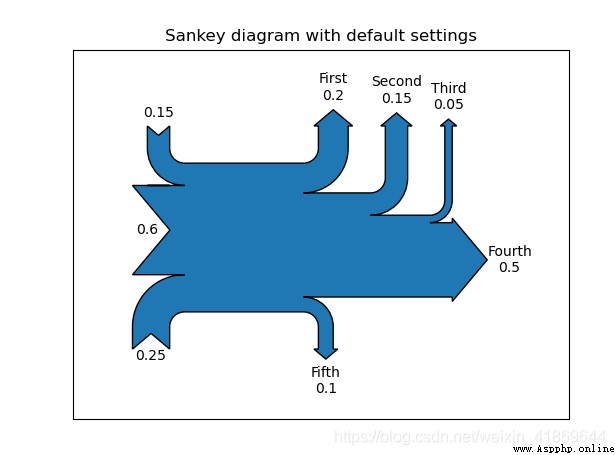
import numpy as np
import matplotlib.pyplot as plt
from matplotlib.sankey import Sankey
my_dpi=96
plt.figure(figsize=(480/my_dpi, 480/my_dpi), dpi=my_dpi)
Sankey(flows=[0.25, 0.15, 0.60, -0.20, -0.15, -0.05, -0.50, -0.10],
labels=['', '', '', 'First', 'Second', 'Third', 'Fourth', 'Fifth'],
orientations=[-1, 1, 0, 1, 1, 1, 0, -1]).finish()
plt.title("Sankey diagram with default settings")
plt.show()
The blogger opened a new official account , I hope you can scan the code and pay attention , Thank you very much .

This article is from :https://github.com/holtzy/The-Python-Graph-Gallery/blob/master/PGG_notebook.py