Excel
1、 Turn the table into a super table
Implementation method :Ctrl+T function : When there is new data , Data graphics are updated in time
2、 Create a pivot table
Alt + D +P
3、 Dynamic charts
https://jingyan.baidu.com/article/5225f26bb4e00ee6fb090811.html
4、index function
grammar :index(reference,row_now,column_num,area_num) Parameters : reference: It's necessary , A reference to one or more cells . row_num: The line number of a line in the reference , Function returns a reference from the line . column_num: Optional , The column label of a column in a reference ,, Function returns a reference from the column . area_num: Optional , Select a reference area , Return from this area row_num and column_num Intersection 5、 “ return int ” Type in :=DATEDIF(C5,C6,"D"), Be careful : among ,C5 For the start date ,C6 For the end date ,D Then calculate the daily difference .
database
1、 Can be added to the database table , Add data to the specified column
insert into sku_data (sku,cw_type) values (%s,%s)
Python
1、 utilize python Sort groups :
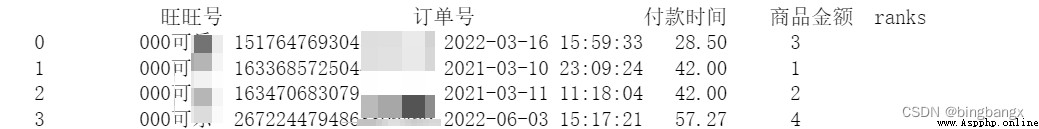
According to Wangwang No , The order number , Amounts are grouped , And sort by payment time
data1['ranks'] = data.groupby([' Wangwang ',' The order number ',' The amount of goods '][' Time of payment '].rank().astype(int)
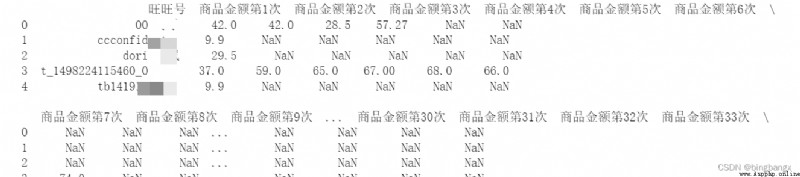
2、 utilize Python Build a two-tier index , And turn the double layer into a layer .
data2 = pd.pivot_table(data1,values = [' The amount of goods '],index = [' Wangwang ',' Time of payment '],columns =['ranks'])data2.columns.tolist()
# Rename column names
data2.columns =[str(s1) +" The first "+str(s2)+" Time " for (s1,s2) in data2.columns.tolist()]data2.reset_index(inplace =True) # Reset index , Then flatten the index
3、 Distribution density diagram , Visual mapping method :sns.distplot()
Auxiliary line drawing method :plt.axvline()
4、 Change the proportion into the form of percentage
bk_std_fsl[' Proportion of orders '] = bk_std_fsl[' Number of orders '].apply(lambda x: '%.2f%%' % (x / bk_std_fsl[' Number of orders '].sum() * 100))
5、 Remove missing values
data.dropna(inplace = True) # Remove missing values
6、python pandas Remove duplicates
Remove all duplicates :df.drop_duplicates(inplace = True)
Remember: (inplace = True) Will ensure that the method does not return a new DataFrame, But it will change from the original DataFrame Delete all duplicates .
7、 Replace various types of data
For example DataFrame Null value in , Some strings, etc. are all replaced with 0 replace([na.nan,' No data ',' countless '],0,inplace = True)
8、 Transposition
data.T
9、numpy.concatenate() Method
numpy Provides numpy.concatenate((a1,a2,a3,……),axis =0), It can splice multiple arrays at one time , among a1,a2,a3 Is an array type parameter .
a = np.array([2,3,4])b = np.array([11,22,22])c = np.array([55,88,99])np.concatenate((a,b,c),axis =0) # By default ,axis=0 Don't write array([ 2, 3, 4,11, 22, 22, 55, 88,99]) # For one-dimensional array splicing ,axis The value of does not affect the final result .
for example :
angle= np.linspace(0,2*np.pi,4,endpoint=False) # Set the display position of each data point angle = np.concatenate((angle,[angle[0]]))

10、pd.cut() Parameters
pd.cut(x,bins,right=True,labels=None,retbins=False,precision=3,include_lowest=False,duplicates='raise')
- x : One dimensional array
- bins : Integers , Scalar sequence or interval index , It is the basis for grouping ,
If you fill in an integer n, Will be x The values in are divided into equal width n Share ( That is, the difference between the maximum value and the minimum value in each group is approximately equal ); If it's a scalar sequence , The values in the sequence represent the dividing values used for grading If it is an interval index ,“ bins” The interval indexes of must not overlap
- right : Boolean value , The default is True Indicates that it contains the rightmost value
When “ right = True”( The default value is ) when , be “ bins”=[1、2、3、4] Express (1,2],(2,3],(3,4] When bins Is an interval index , This parameter is ignored .
- labels : Array or Boolean , Optional . Specify the label of the sub box
If it's an array , The length should be consistent with the number of boxes , such as “ bins”=[1、2、3、4] Express (1,2],(2,3],(3,4] altogether 3 Intervals , be labels The length of the tag is the number of tags 3 If False, Then only the integer indicator of the bin is returned , namely x The data in is in the first few boxes When bins Is the interval index , This parameter will be ignored
- retbins: Whether to display the boundary value of sub box . The default is False, When bins When taking an integer, you can set retbins=True To display the boundary value , Get the divided interval
- precision: Integers , Default 3, Accuracy of storing and displaying sub box labels .
- include_lowest: Boolean value , Indicates whether the left side of the interval is open or closed , The default is false, That is, the left side of the interval is not included .
- duplicates: If the critical value of container separation is not unique , The cause ValueError Or discard non unique
11、matplotlib.pyplot.axvline()
Parameters :x: In data coordinates x Position to place the vertical line
ymin:y The starting position of the vertical line on the axis , It will take 0 To 1 Between the value of the ,0 It's the bottom of the shaft ,1 It's the top of the shaft
ymax:y The end position of the vertical line on the axis , It will take 0 To 1 Between the value of the ,0 It's the bottom of the shaft ,1 It's the top of the shaft
**kwargs: Other optional parameters can change the properties of the line , for example Color change , Line width, etc
12、 Set gridlines
The following example adds a simple gridline , And set the style of gridlines , The format is as follows :grid(color ='color', linestyle ='linestyle', linewidth = number)
Parameter description : color:'b' Blue ,'m' Magenta ,'g' green ,'y' yellow ,'r' Red ,'k' black ,'w' white ,'c' Turquoise ,'#008000' RGB Color string .
linestyle:'' Solid line ,'' Broken line ,'.' Point line ,':' Dotted line .
linewidth: Set the width of the line , You can set a number .
13、matplotlib Area stacking diagram
data.plot.area(colormap='',figsize =(x,y)) colormap Represents the color block to be used
14、matplotlib Radar map
- Drawing radar maps , You need to establish polar coordinates first ;
- After building the polar coordinates , Histogram can be drawn in polar coordinate system , Line chart, etc , In most cases, line charts are used , Form an irregular closed polygon .
Draw multiple points , And the first point is the same as the last point , Make it a closed figure . plt.polar( radian , radius ,"ro",lw) # The radian system is used , Use radians to express degrees ;ro in r It means red ,o For shape ;lw Indicates the size of the point for example : 360 degree , Express 2Π(2*np.pi);180 Degree means Π(np.pi) plt.polar(0.25*np.pi,20,)