explain : This is a practical project of machine learning ( Incidental data + Code + file + Video Explanation ), If you need data + Code + file + Video Explanation You can get it directly at the end of the article .
1. Project background
Economic advertising refers to advertising for profit , Usually commercial advertisements , It is to promote goods or provide services , A means of disseminating information about goods or services to consumers or users through advertising media in the form of payment . Commodity advertising is such economic advertising . To promote the sales of products , Manufacturers often put advertisements through multiple channels . This project will be based on a company's experience in television 、 Advertising data on radio and newspapers predict advertising revenue , As an important reference for the company to formulate advertising strategies .
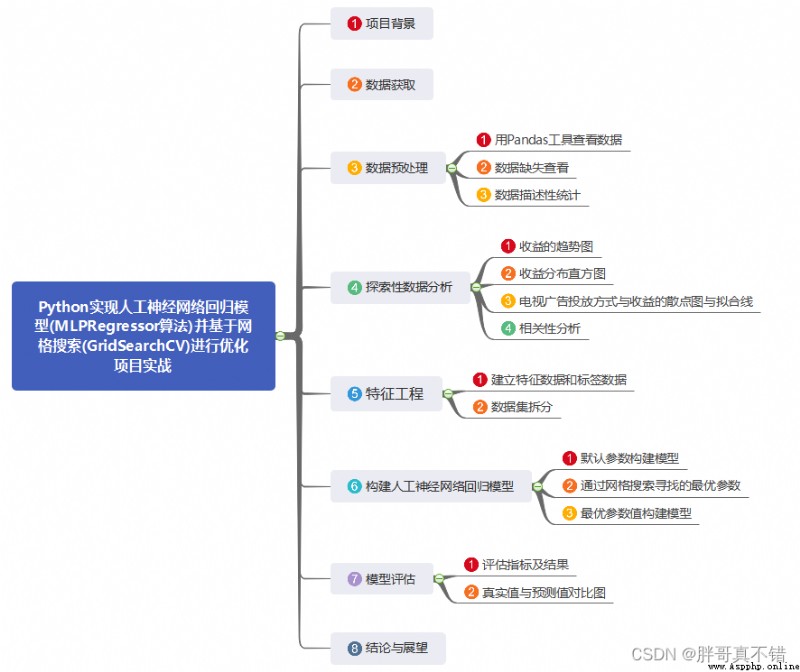
This project forecasts the advertising data through the artificial neural network regression model , And optimize the model through grid search algorithm , Make the model achieve the best effect .
2. Data acquisition
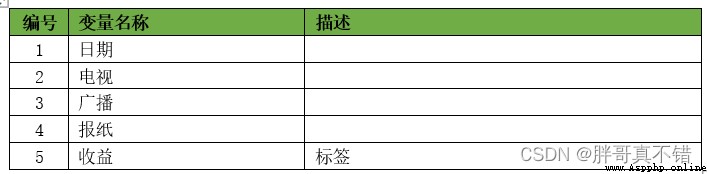
The modeling data comes from the network ( Compiled by the author of this project ), The statistics of data items are as follows :
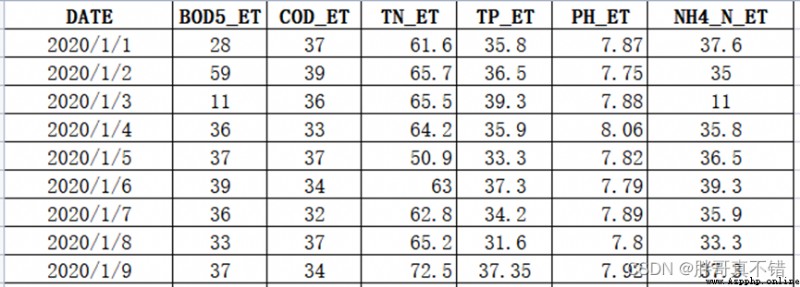
The details of the data are as follows ( Part of the show ):
3. Data preprocessing
3.1 use Pandas Tool view data
Use Pandas The tool head() Method to view the first five rows of data :
Key code :

3.2 Missing data view
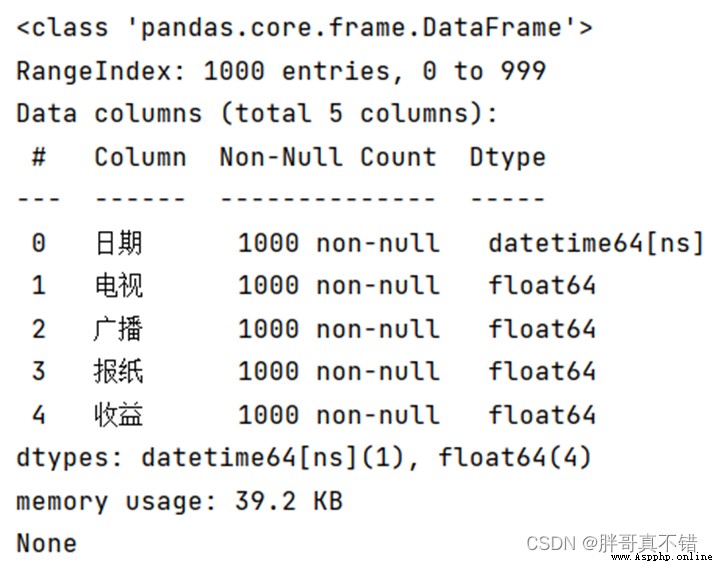
Use Pandas The tool info() Method to view data information :
You can see from the above picture that , All in all 5 A variable , There are no missing values in the data , common 1000 Data .
Key code :
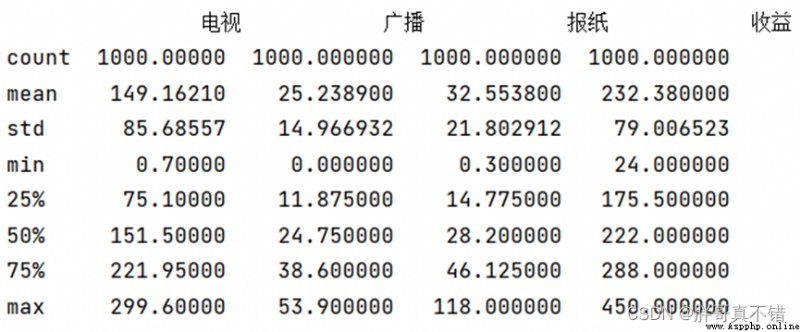
3.3 Descriptive statistics
adopt Pandas The tool describe() Method to see the average of the data 、 Standard deviation 、 minimum value 、 quantile 、 Maximum .
The key codes are as follows :

4. Exploratory data analysis
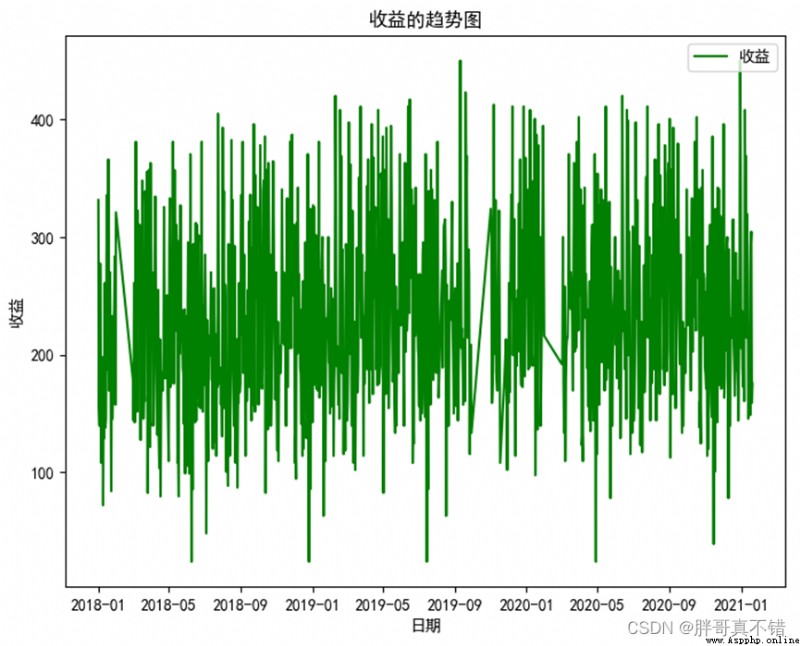
4.1 Trend chart of revenue
use Matplotlib The tool plot() Methods draw a line chart :
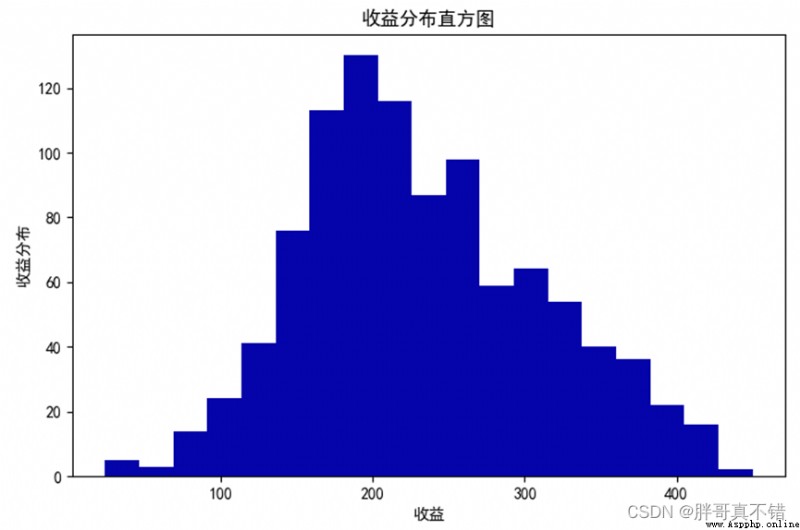
4.2 Income distribution histogram
use Matplotlib The tool hist() Method draw histogram :
As can be seen from the above figure , The income is mainly distributed in 150~250 Between .
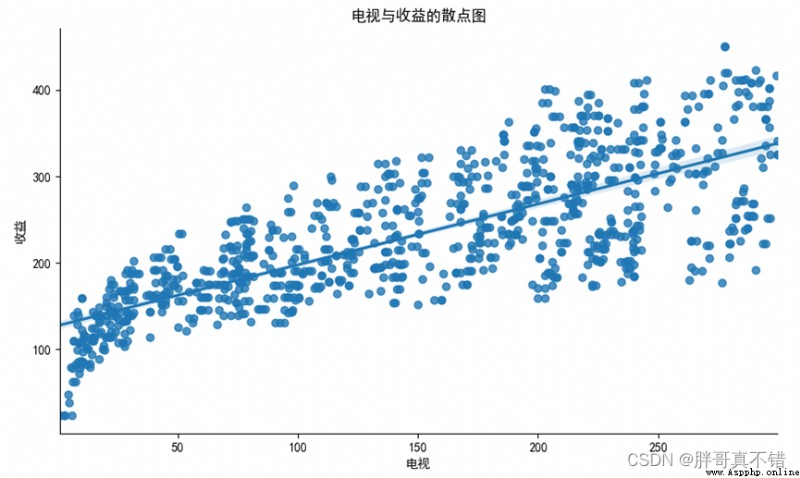
4.3 Scatter diagram and fitting line of TV advertising delivery mode and revenue
use seaborn The tool lmplot () Methods draw the scatter diagram and fitting line :
As can be seen from the above figure , There is a good linear relationship between TV advertising investment and income .
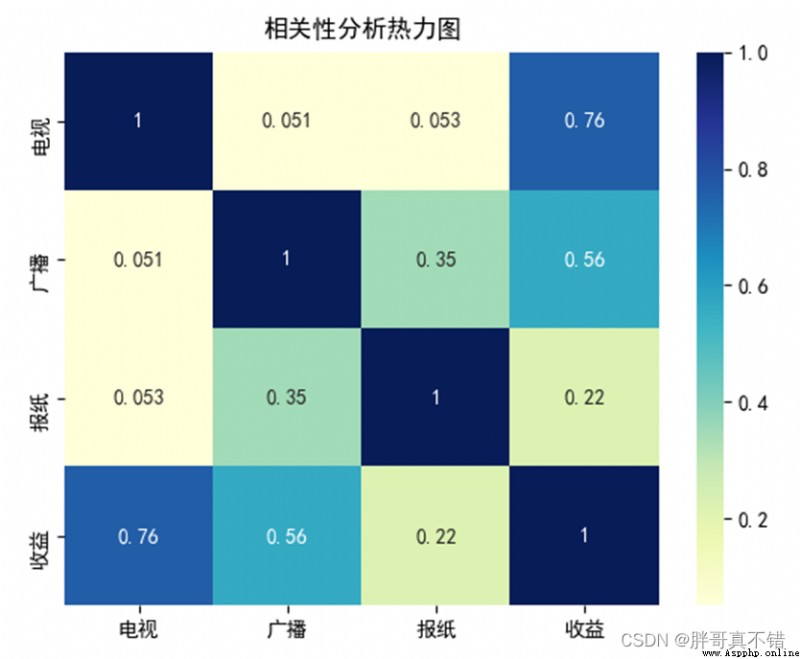
4.4 correlation analysis
As you can see from the above figure , The larger the value, the stronger the correlation , A positive value is a positive correlation 、 A negative value is a negative correlation .
5. Feature Engineering
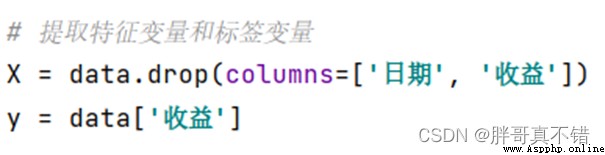
5.1 Establish characteristic data and label data
The key codes are as follows :
5.2 Data set splitting
adopt train_test_split() Method according to 80% Training set 、20% Divide the test set , The key codes are as follows :
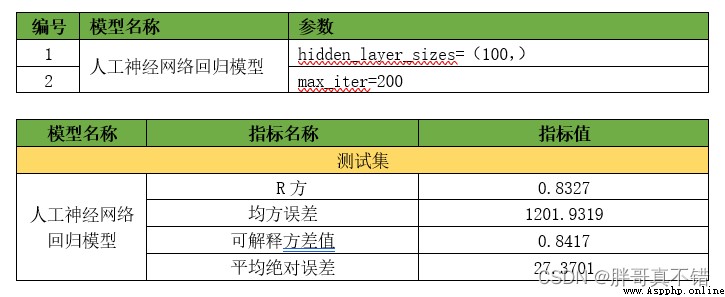
6. Build artificial neural network regression model
The main use of MLPRegressor Algorithm and grid search optimization algorithm , For target regression .
6.1 Build the model with default parameters
6.2 The optimal parameters found by grid search
Key code :
Optimal parameters :
6.3 The optimal parameter value constructs the model
7. Model to evaluate
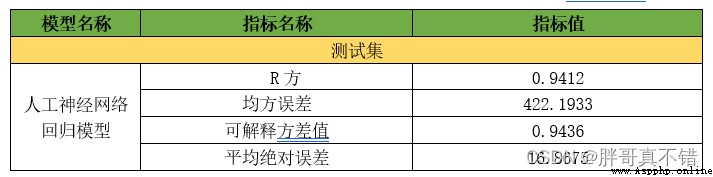
7.1 Evaluation indicators and results
The evaluation index mainly includes the interpretable variance value 、 Mean absolute error 、 Mean square error 、R Square value, etc .
As can be seen from the table above ,R Party for 0.9412 Better than the default parameter ; The interpretable variance is 0.6777 Better than the default parameter , The optimized regression model has good effect .
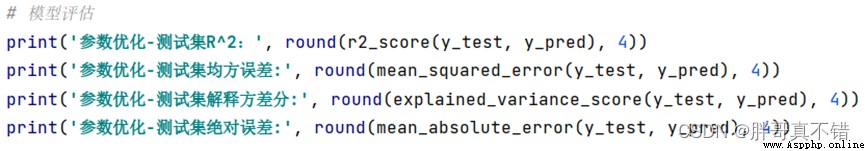
The key codes are as follows :
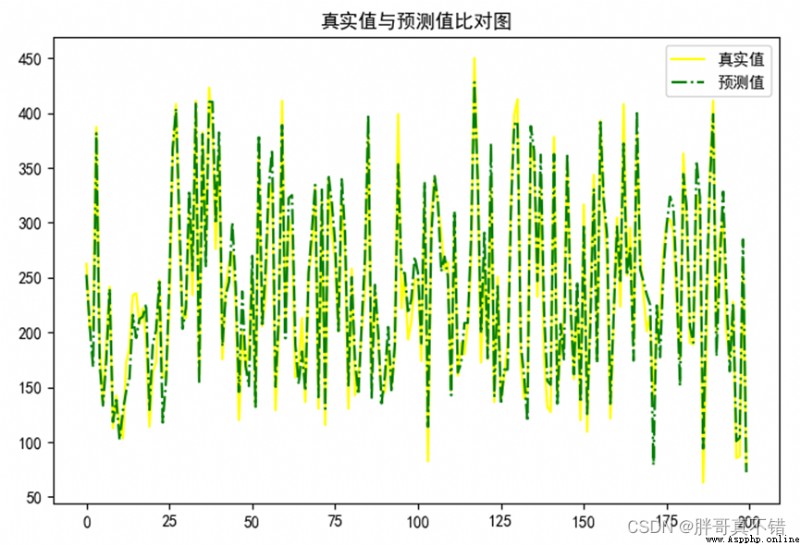
7.2 Comparison between real value and predicted value
It can be seen from the above figure that the fluctuations of the real value and the predicted value are basically the same , The fitting effect of the model is good .
8. Conclusion and Prospect
in summary , In this paper, the artificial neural network regression algorithm is used to build the regression model , Find the optimal number of hidden layers and neurons through the grid search algorithm , Finally, it is proved that the effect of our proposed model is very good , It can be used to predict in actual production , Make the enterprise develop better , More profits .
The materials needed for the actual combat of this machine learning project , The project resources are as follows :
Project description :
link :https://pan.baidu.com/s/1dW3S1a6KGdUHK90W-lmA4w
Extraction code :bcbpIf the network disk fails , You can add blogger wechat :zy10178083
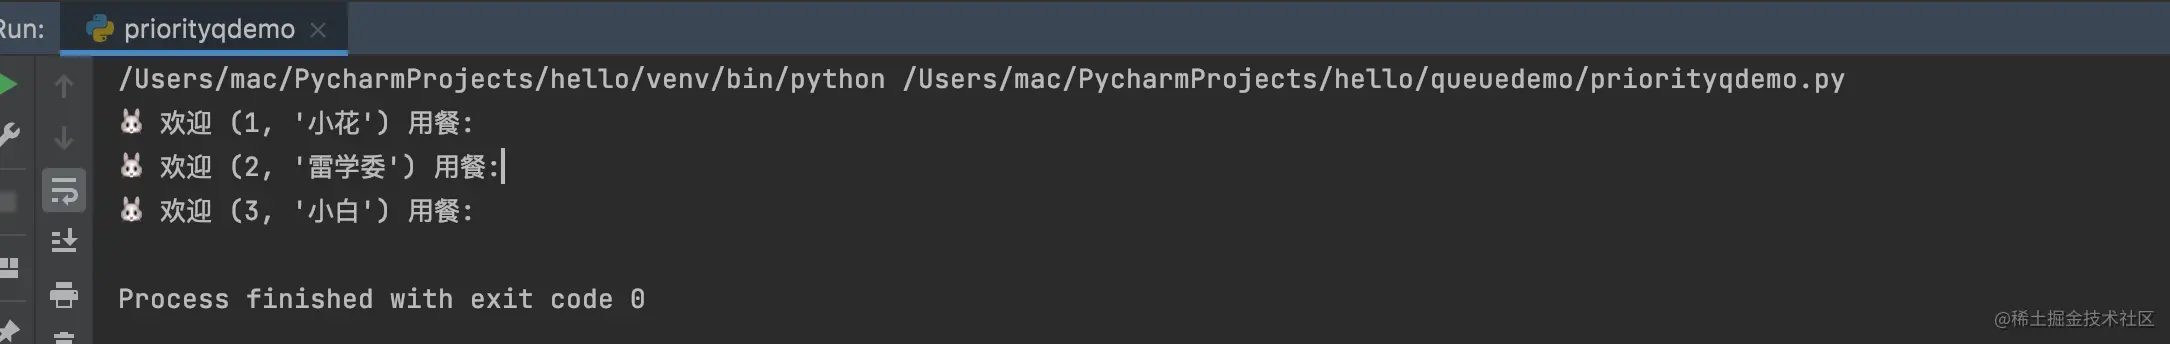 Python built-in priority queue PriorityQueue advanced restaurant dining scene display
p{margin:10px 0}.markdown-body
 [Python app automation test practice part ⑥] - Practice - appium common element location methods for locating mobile phone elements
Wanyeji Faint thunder , Cloud