explain : This is a practical project of machine learning ( Incidental data + Code + file + Video Explanation ), If you need data + Code + file + Video Explanation You can get it directly at the end of the article .
1. Project background
Housing price has become the focus of Chinese society . At this stage, why does China's housing prices rise too fast and always become the focus of social attention ; I believe that China's house prices will still rise in general in the future , The pressure of rising house prices will shift to second tier cities, especially those in the central and western regions . So , Real estate regulation should aim at the regional differentiation of housing prices , Implement differentiated housing policies ; In response to structural changes in housing demand , Optimize the housing supply structure ; In view of the changes in the transaction structure of the housing market , Adjust the key areas of real estate regulation .
In this project, Bayesian ridge regression model is used to integrate various factors to model the house price prediction model , And pass K Fold cross validation to evaluate the house price model .
2. Data acquisition
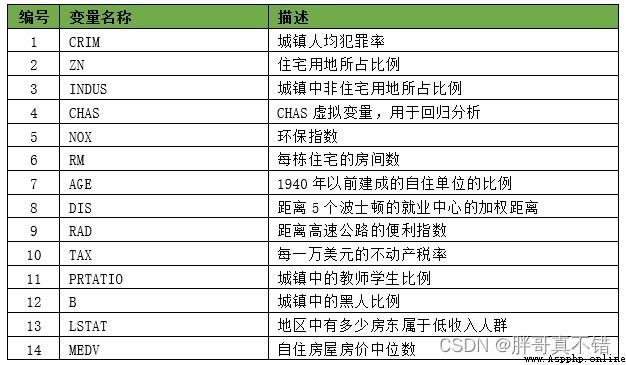
The modeling data comes from the network ( Compiled by the author of this project ), The statistics of data items are as follows :
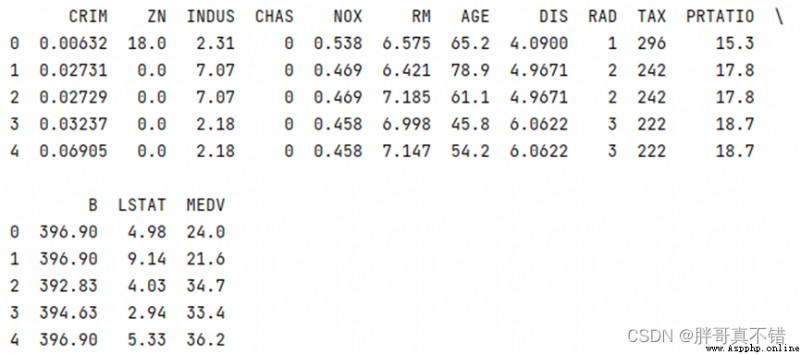
The details of the data are as follows ( Part of the show ):
3. Data preprocessing
3.1 use Pandas Tool view data
Use Pandas The tool head() Method to view the first five rows of data :
Key code :
3.2 Missing data view
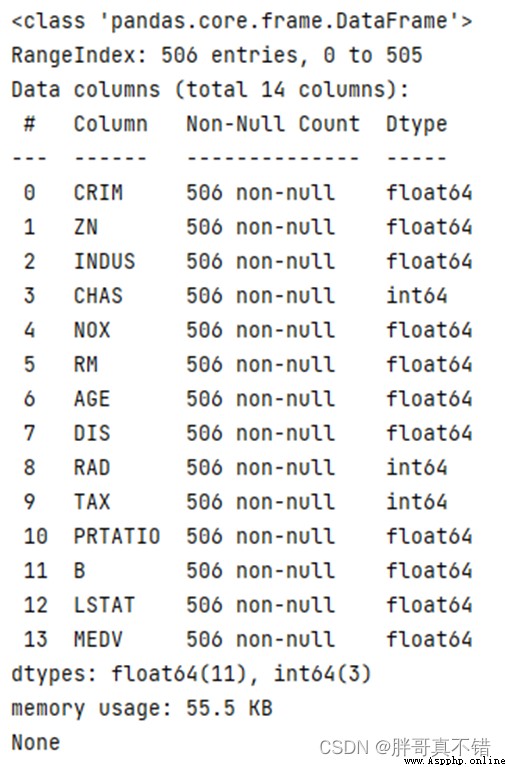
Use Pandas The tool info() Method to view data information :
You can see from the above picture that , All in all 14 A variable , There are no missing values in the data , common 506 Data .
Key code :
3.3 Descriptive statistics
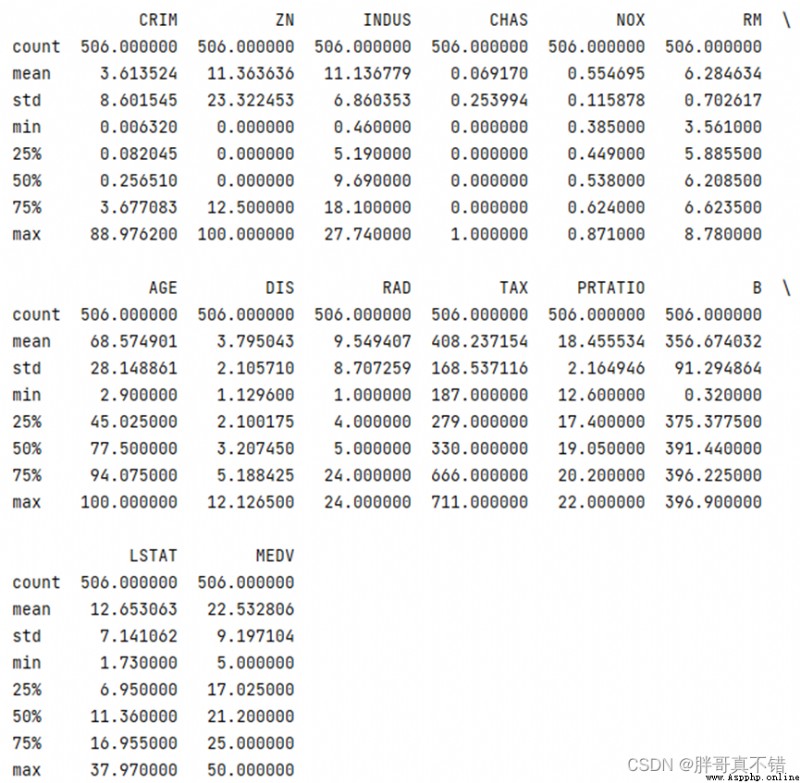
adopt Pandas The tool describe() Method to see the average of the data 、 Standard deviation 、 minimum value 、 quantile 、 Maximum .
The key codes are as follows :
4. Exploratory data analysis
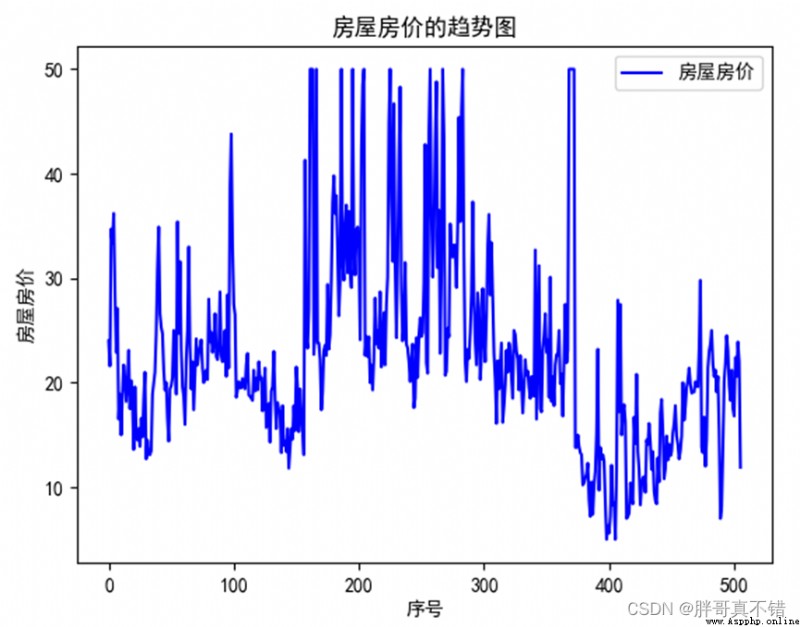
4.1 Trend chart of housing prices
use Matplotlib The tool plot() Methods draw a line chart :
4.2 Histogram of housing price distribution
use Matplotlib The tool hist() Method draw histogram :
As can be seen from the above figure , Housing prices are mainly distributed in 115~25 Between .
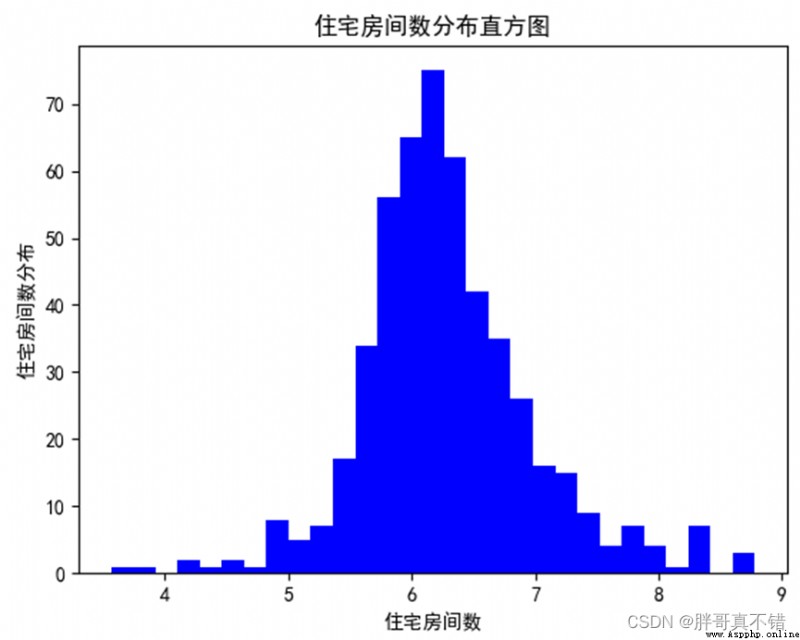
4.3 Residential room number distribution histogram
use Matplotlib The tool hist() Method draw histogram :
As can be seen from the above figure , The number of residential rooms is mainly distributed in 5.5~7.
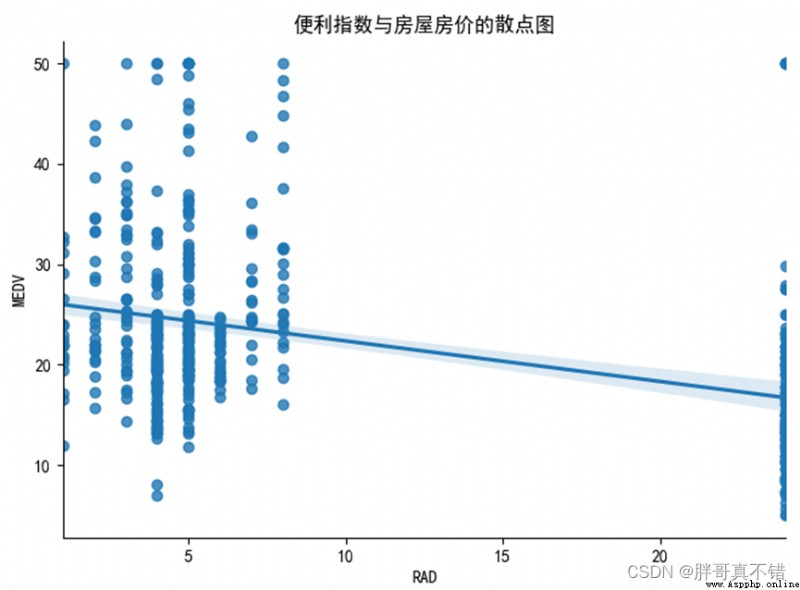
4.4 Scatter plot and fitting line of convenience index and housing price
use seaborn The tool lmplot () Methods draw the scatter diagram and fitting line :
As can be seen from the above figure , There is no linear relationship between the convenience index of the distance from the highway and the house price .
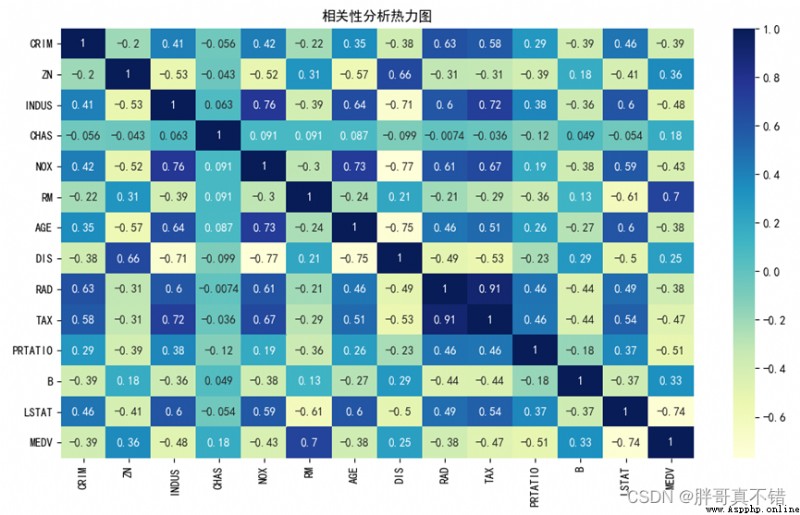
4.5 correlation analysis
As you can see from the above figure , The larger the value, the stronger the correlation , A positive value is a positive correlation 、 A negative value is a negative correlation .
5. Feature Engineering
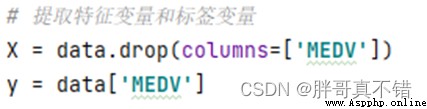
5.1 Establish characteristic data and label data
The key codes are as follows :
5.2 Data set splitting
adopt train_test_split() Method according to 80% Training set 、20% Divide the test set , The key codes are as follows :
6. Build Bayesian ridge regression model
The main use of BayesianRidge Algorithm 、 Grid search optimization algorithm and K Crossover verification , For target regression .
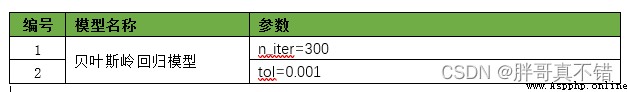
6.1 Build the model
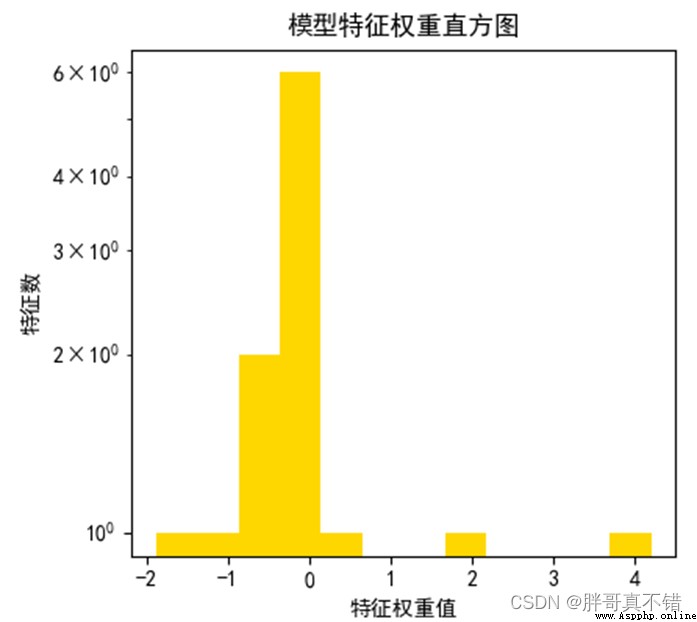
6.2 Histogram of model feature weight value
You can see from the above picture that , The weight values of features are mainly concentrated in -0.5~1 Between .
7. Model to evaluate
7.1 Evaluation indicators and results
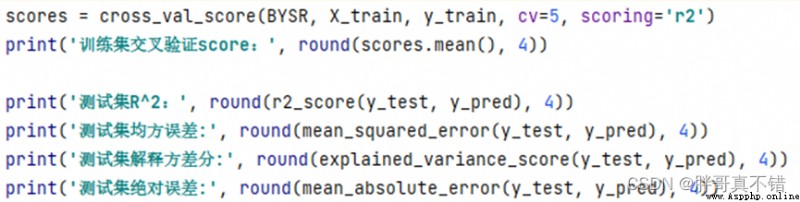
The evaluation index mainly includes the interpretable variance value 、 Mean absolute error 、 Mean square error 、R Square value, etc .
As can be seen from the table above ,R Party for 0.6639; The interpretable variance is 0.666 The effect of the model is average , Further optimization can be carried out as needed .
The key codes are as follows :
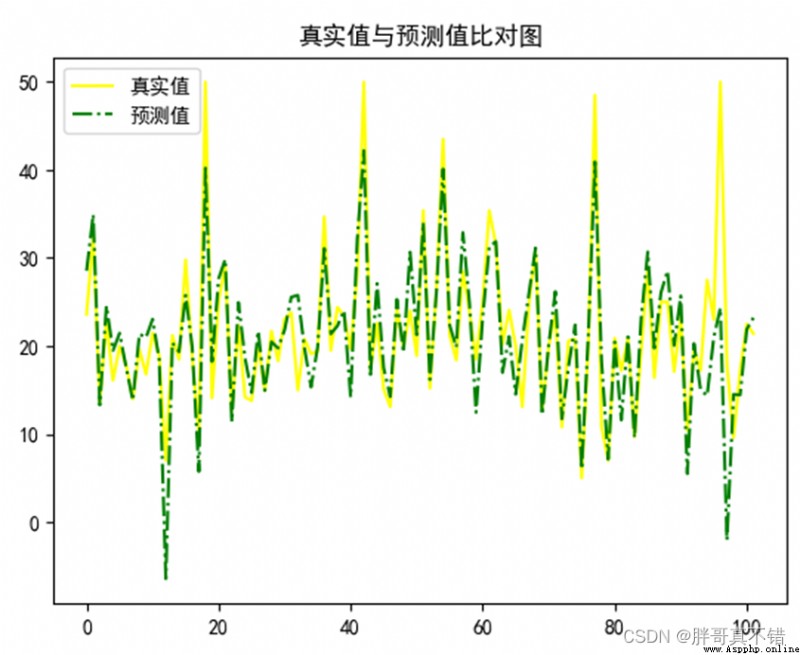
7.2 Comparison between real value and predicted value
It can be seen from the above figure that the fluctuations of the real value and the predicted value are basically the same .
8. Conclusion and Prospect
in summary , In this paper, Bayesian ridge regression algorithm is used to build the regression model , And Application 5 Fold cross validation for model evaluation , There are many factors affecting house prices , This project is preliminarily discussed 、 Research .
The materials needed for the actual combat of this machine learning project , The project resources are as follows :
Project description :
link :https://pan.baidu.com/s/1dW3S1a6KGdUHK90W-lmA4w
Extraction code :bcbpIf the network disk fails , You can add blogger wechat :zy10178083