The code is as follows :
import pandas as pd
from scipy import stats
valueList = [-0.010185, 0.011844, -0.00852, -0.01888, 0.001009, 0.005242, 0.019054, -0.030944, 0.013519, -0.029266, 0.002225]
if __name__ == '__main__':
average = pd.DataFrame(valueList).mean()
standardError = pd.DataFrame(valueList).std()
print(" Sample mean :", average)
print(" Sample standard error ( Here is except n-1 Not n):", standardError)
print(stats.t.interval(0.95, len(pd.DataFrame(valueList)) - 1, average, standardError))
pass
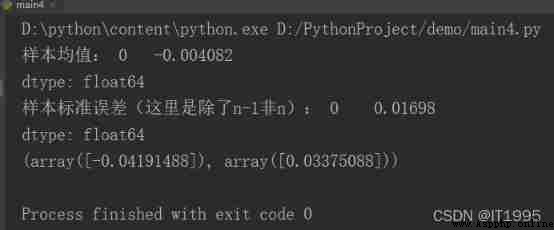
The running screenshot is as follows :

One thing to note here , Now there are two kinds of variance and standard deviation , One is to divide by n Of (n Is the total number of samples ), One is to divide by n-1 Of ( The total number of samples -1)
One is for the whole , In the formula is divided by n;
One is for samples , In the formula is divided by n-1, The full name is sample standard deviation . Denominator divided by n-1;
Data in international life are basically samples , So divide by n-1;
Through the following series of yield
valueList = [-0.010185, 0.011844, -0.00852, -0.01888, 0.001009, 0.005242, 0.019054, -0.030944, 0.013519, -0.029266, 0.002225]Available , This stock , Yes 95% The possibility of , The yield range is -0.0419~0.03375 Between .