Data sets
The main program
import matplotlib.pyplot as plt
from gezhongmatlab import *
from matplotlib import font_manager
# Set the font to use , Microsoft YaHei is used here
my_font = font_manager.FontProperties(fname='C:\Windows\Fonts\MSYH.TTC')
path = r"run_lh_1.dat"
bf = read_bf_file(path)
csi_list = list(map(get_scale_csi,bf))
csi_np = (np.array(csi_list))
csi_amp = np.abs(csi_np)
csi_pha=np.angle(csi_np)
np.set_printoptions(threshold=np.inf)
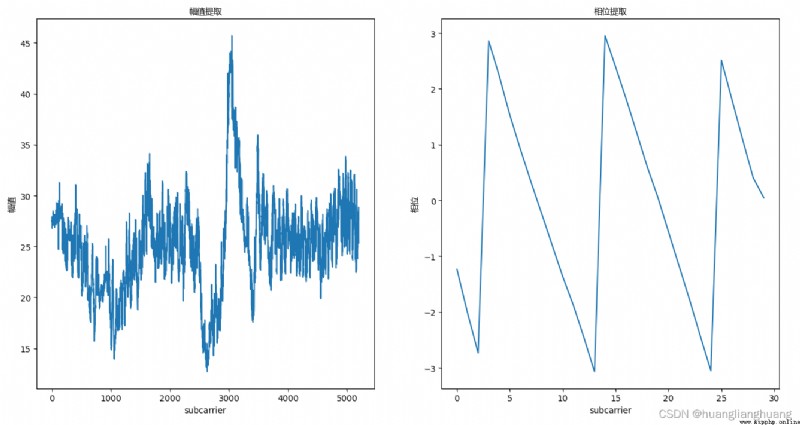
fig = plt.figure()
plt.subplot(1,2,1)
plt.plot(csi_amp[:, 0, 0, 0])
plt.title(' Amplitude extraction ',fontproperties = my_font)
plt.xlabel('subcarrier')
plt.ylabel(' amplitude ',fontproperties = my_font)
plt.subplot(1,2,2)
plt.plot(csi_pha[100,0,0,:])
plt.title(' Phase extraction ',fontproperties = my_font)
plt.xlabel('subcarrier')
plt.ylabel(' phase ',fontproperties = my_font)
plt.show()
Here I need to refer to another article
use python extract CSI Amplitude information
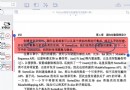
Run a screenshot :