import matplotlib.pyplot as plt
from matplotlib import font_manager
# Set the font to use , Microsoft YaHei is used here
my_font = font_manager.FontProperties(fname='C:\Windows\Fonts\MSYH.TTC')
x=list(range(5))
y=list(range(5))
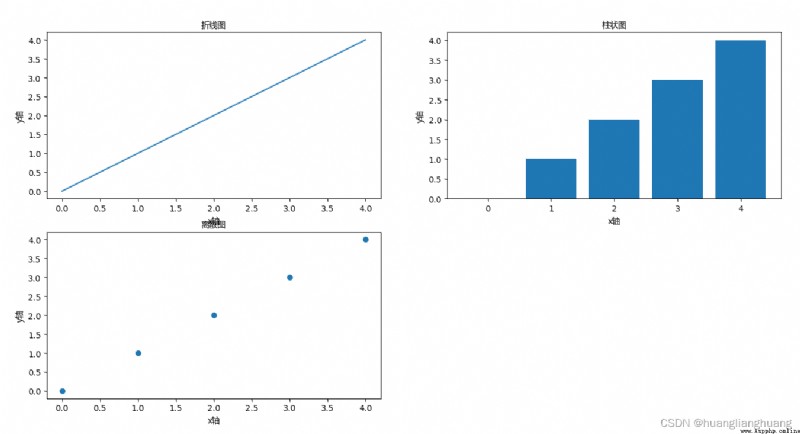
plt.figure()
# Draw a line
plt.subplot(2,2,1)
plt.xlabel('x Axis ',fontproperties = my_font)
plt.ylabel('y Axis ',fontproperties = my_font)
plt.title(' Broken line diagram ',fontproperties = my_font)
plt.plot(x,y)
# Histogram
plt.subplot(2,2,2)
plt.xlabel('x Axis ',fontproperties = my_font)
plt.ylabel('y Axis ',fontproperties = my_font)
plt.title(' Histogram ',fontproperties = my_font)
plt.bar(x,y)
# Discrete graphs
plt.subplot(2,2,3)
plt.xlabel('x Axis ',fontproperties = my_font)
plt.ylabel('y Axis ',fontproperties = my_font)
plt.title(' Discrete graphs ',fontproperties = my_font)
plt.scatter(x,y)
plt.show()
The operation results are as follows :