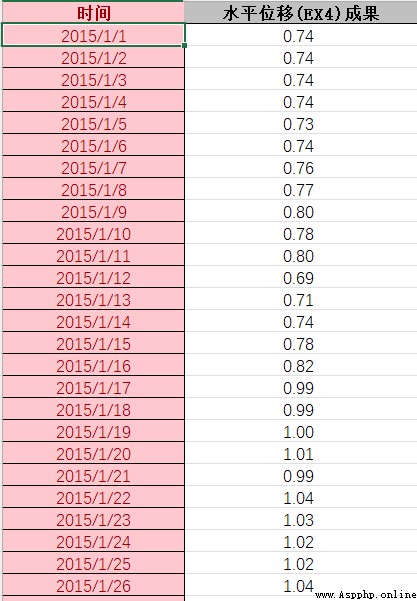
① How to use DBSCAN The algorithm cleans the abnormal data of time series ? My data format is shown below :( Do you need to convert date variables to numeric variables ? How to achieve it )

② Here's what I found DBSCAN Algorithm related code , The original code is from txt Enter data in the file , Excuse me, if I want to get from my excel Where should the input data be changed ?
import numpy as np
import matplotlib.pyplot as plt
import math
import time
UNCLASSIFIED = False
NOISE = 0
def loadDataSet(fileName, splitChar='\t'):# Define a function with two parameters
"""
Input : file name
Output : Data sets
describe : Read data set from file
"""
dataSet = [] # Create an empty list
with open(fileName) as fr:# Open the file and assign it to fr
for line in fr.readlines():# Take each line of the text file as an independent string object and put these objects into the list to return . Ergodic to line
curline = line.strip().split(splitChar)#strip() If there are no parameters , The default is to clear the blank characters on both sides ,split(splitChar)
# take line String according to splitChar='\t' Cut into multiple strings and store them in a list , Assign to curline
fltline = list(map(float, curline))# Each value of the cut out list , use float The function turns them into float type , list() Function map The iterator returned by the function is iterated and expanded into a list and assigned to fltline
dataSet.append(fltline)# Add to the empty list created before dataSet in
return dataSet
def dist(a, b):
"""
Input : vector A, vector B
Output : Euclidean distance of two vectors
"""
return math.sqrt(np.power(a - b, 2).sum())
def eps_neighbor(a, b, eps):
"""
Input : vector A, vector B
Output : Whether in eps Within the scope of
"""
return dist(a, b) < eps
def region_query(data, pointId, eps):
"""
Input : Data sets , Query point id, Radius size
Output : stay eps Of points within the range id
"""
nPoints = data.shape[1]
seeds = []
for i in range(nPoints):
if eps_neighbor(data[:, pointId], data[:, i], eps):
seeds.append(i)
return seeds
def expand_cluster(data, clusterResult, pointId, clusterId, eps, minPts):
"""
Input : Data sets , Classification results , Points to be classified id, cluster id, Radius size , Minimum number of points
Output : Can you successfully classify
"""
seeds = region_query(data, pointId, eps)
if len(seeds) < minPts: # dissatisfaction minPts Conditional is noise point
clusterResult[pointId] = NOISE
return False
else:
clusterResult[pointId] = clusterId # Divide into this cluster
for seedId in seeds:
clusterResult[seedId] = clusterId
while len(seeds) > 0: # Continuous expansion currentPoint = seeds[0] queryResults = region_query(data, currentPoint, eps) if len(queryResults) >= minPts: for i in range(len(queryResults)): resultPoint = queryResults[i] if clusterResult[resultPoint] == UNCLASSIFIED: seeds.append(resultPoint) clusterResult[resultPoint] = clusterId elif clusterResult[resultPoint] == NOISE: clusterResult[resultPoint] = clusterId seeds = seeds[1:] return Truedef dbscan(data, eps, minPts):
"""
Input : Data sets , Radius size , Minimum number of points
Output : Taxonomic cluster id
"""
clusterId = 1
nPoints = data.shape[1]
clusterResult = [UNCLASSIFIED] * nPoints
for pointId in range(nPoints):
point = data[:, pointId]
if clusterResult[pointId] == UNCLASSIFIED:
if expand_cluster(data, clusterResult, pointId, clusterId, eps, minPts):
clusterId = clusterId + 1
return clusterResult, clusterId - 1
def plotFeature(data, clusters, clusterNum):
nPoints = data.shape[1]
matClusters = np.mat(clusters).transpose()
fig = plt.figure()
scatterColors = ['black', 'blue', 'green', 'yellow', 'red', 'purple', 'orange', 'brown']
ax = fig.add_subplot(111)
for i in range(clusterNum + 1):
colorSytle = scatterColors[i % len(scatterColors)]
subCluster = data[:, np.nonzero(matClusters[:, 0].A == i)]
ax.scatter(subCluster[0, :].flatten().A[0], subCluster[1, :].flatten().A[0], c=colorSytle, s=50)
def main():
dataSet = loadDataSet('788points.txt', splitChar=',')
dataSet = np.mat(dataSet).transpose()
# print(dataSet)
clusters, clusterNum = dbscan(dataSet, 2, 3)
print("cluster Numbers = ", clusterNum)
# print(clusters)
count=0 # Modified_ Used to output the results to a file
m=open('788points.txt').read().splitlines() # Modified_ Used to output the results to a file
out=open('788points_DBSCAN.txt','w') # Modified_ Used to output the results to a file
for n in m: # Modified_ Used to output the results to a file
out.write(n+',{0}\n'.format(clusters[count]))
count+=1
out.close() # Modified_ Used to output the results to a file
plotFeature(dataSet, clusters, clusterNum)
if name == 'main':
start = time.process_time() # Modified_ take time.clock() Replace with time.process_time()
main()
end = time.process_time() # Modified_ take time.clock() Replace with time.process_time()
print('finish all in %s' % str(end - start))
plt.show()
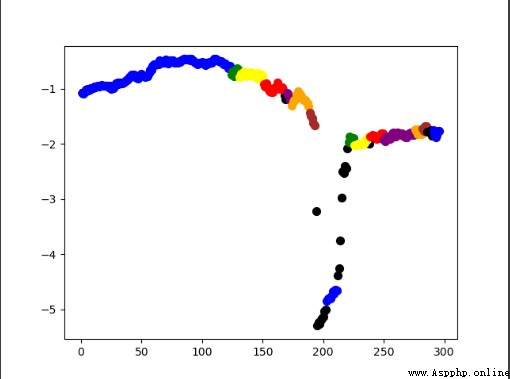
③ Here is the result of running this code : Because I don't know how to change the date type into the numerical type mentioned above , I changed the time to 123456... I don't know .( Adjusted those two parameters for a long time ), I feel that the dots below should be black ( Noise point ) That's right , But what should I do if I can't adjust this effect ?

④ Another problem is this line of code scatterColors = ['black', 'blue', 'green', 'yellow', 'red', 'purple', 'orange', 'brown'] dbscan It is automatically classified ( I don't know in advance how many kinds ), Why can we specify points in advance 8 Class colors ?