Learn how to write an independent program , And visualize it .
utilize Web Application programming interface (API) Automatically request the specific information of the website instead of the whole page , Then visualize the information , In this way, even if the data changes rapidly , The information presented by the program is also up-to-date .
API call : Web API It's part of the website , Used with very specific URL Program interaction that requests specific information . The requested data will be in an easy to handle format (JOSN, CSV) return .
actual combat : Use GitHub Of API Request information about python Information , Use Pygal Generate interactive visualization , Show the popularity of these projects .
Open the following URL
https://api.github.com/search/repositories?q=language:python&sort=starts
This call returns GitHub How many are currently hosted python project , And about the most popular python Warehouse information .
Explain and call :
https://api.github.com/ Send the request to GitHub Corresponding in the website API Part of the call
search/repositories Search all GitHub In the warehouse
q=q Represents a query = Specify query
language:python Use the language python Warehouse item information for
&sort=starts Sort the items according to the stars obtained
The corresponding first few lines are shown below . From the response , The URL Not suitable for manual input 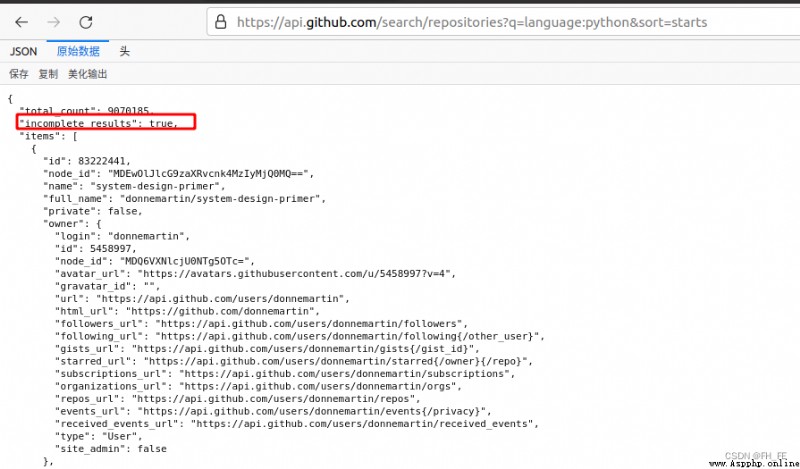 “total_count”: 9070185, The moment this article was written ,GitHub common 9070185 individual python project
“incomplete_results”: true, The request is successful .true,GitHub This... Cannot be fully handled API; if false, The request is not complete
item It includes GitHub The most popular Python Project details
requests The package requests information from the web site and checks the returned response
Check out your own conda Environmental Science
conda env list

Activate the environment to use
conda activate pythonProject
install requests package
pip install --user requests
Write a program , perform API call , And deal with the results , find GitHub The highest star Python project :
import requests
# perform API Call and store the response
url = 'https://api.github.com/search/repositories?q=language:python&sort=starts'
# take url Pass to r, Then store the response object in the variable r in
r = requests.get(url)
# By looking at a... Of the response object status_code attribute , Know whether the request is successful ( Status code 200 Indicates that the request was successful )
print("Status code:", r.status_code)
# take API The response is stored in a variable ( Will return json Format information is converted into python Dictionaries )
response_dict = r.json()
# Processing results , Check the key values
print(response_dict.keys())
Call the program to view the results 
python_repos.py
import requests
# perform API Call and store the response
url = 'https://api.github.com/search/repositories?q=language:python&sort=starts'
# take url Pass to r, Then store the response object in the variable r in
r = requests.get(url)
# By looking at a... Of the response object status_code attribute , Know whether the request is successful ( Status code 200 Indicates that the request was successful )
print("Status code:", r.status_code)
# take API The response is stored in a variable ( Will return json Format information is converted into python Dictionaries )
response_dict = r.json()
print("Total repositories:", response_dict['total_count']) # Check how many warehouses there are
# Explore information about the warehouse
repo_dicts = response_dict['items'] # Each and items All relevant dictionaries contain a reference to python Warehouse information
print("Repositories returned:", len(repo_dicts)) # Check the information of how many warehouses you get
# Study the first warehouse
repo_dict = repo_dicts[0]
print("\nKeys:", len(repo_dict)) # Check how much information is in the first warehouse
for key in sorted(repo_dict.keys()): # Print all the information
print(key)
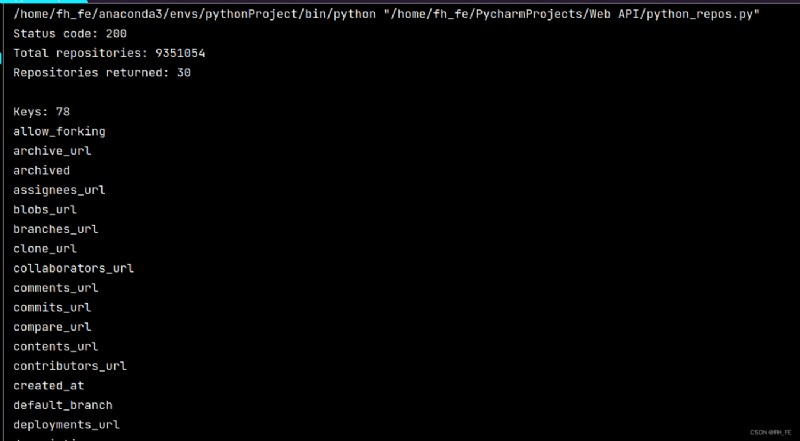
Extract below repo_dict Values associated with some keys in :
python_repos.py
--snip--
# Study the first warehouse
repo_dict = repo_dicts[0]
print("\nSelected information about first repository:")
print('Name:', repo_dict['name']) # Project name
print('Owner:', repo_dict['owner']['login']) # ['owner'] Get the dictionary of the project owner ['login'] Get the login name of the project owner
print('Stars:', repo_dict['stargazers_count']) # To obtain the star Count
print('Repository:', repo_dict['html_url'])
print('Created:', repo_dict['created_at']) # Time of establishment
print('UPdate:', repo_dict['updated_at']) # Last updated
print('Description:', repo_dict['description'])
 Writing articles at the moment , The most popular project is system-design-primer
View the information of each warehouse
python_repos.py
--snip--
# Study information about the warehouse
print("\nSelected information about each repository:")
# Print a descriptive message
for repo_dict in repo_dicts:
print('\nName:', repo_dict['name']) # Project name
print('Owner:', repo_dict['owner']['login']) # ['owner'] Get the dictionary of the project owner ['login'] Get the login name of the project owner
print('Stars:', repo_dict['stargazers_count']) # To obtain the star Count
print('Repository:', repo_dict['html_url'])
print('Created:', repo_dict['created_at']) # Time of establishment
print('UPdate:', repo_dict['updated_at']) # Last updated
print('Description:', repo_dict['description'])
majority API There are rate limits , That is, there is a limit on the number of executable requests within a specific time .
Know if you are close to GitHub The limitation of , You can enter the following URL to view
https://api.github.com/rate_limit
You will see the following response 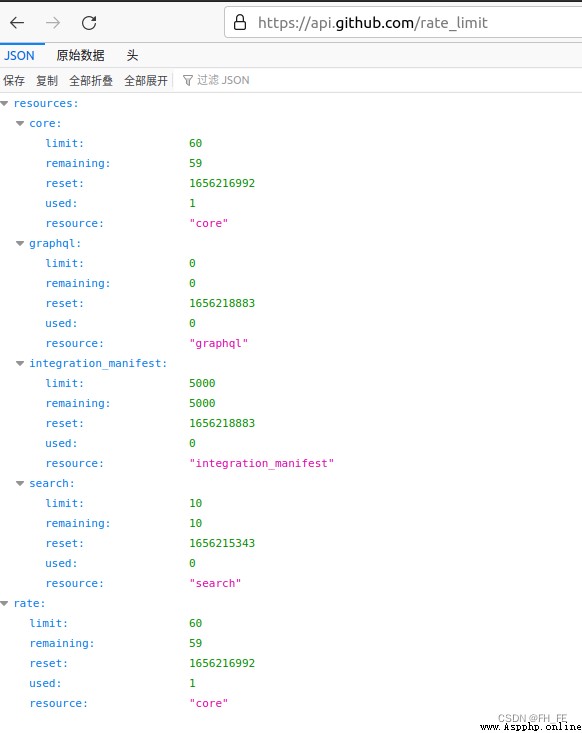
The information we care about is search API Speed limit
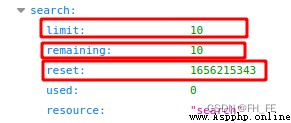
limit The limit is per minute 10 A request
remaining Currently, it can be executed within one minute 8 A request
reset When the quota will be reset Unix Time or new era time (1970 year 1 month 1 How many seconds after midnight )
After using up the quota , You will receive a simple response , From this we know that we have reached API limit . After reaching the limit, you must wait for the quota to reset .
Be careful : quite a lot API Are required to register for API Key before execution API call ,GitHub There is no such requirement , But get API After key , The quota will be much higher .
python_repos.py
import requests
import pygal
from pygal.style import LightColorizedStyle as LCS, LightStyle as LS
# perform API Call and store the response
url = 'https://api.github.com/search/repositories?q=language:python&sort=starts'
# take url Pass to r, Then store the response object in the variable r in
r = requests.get(url)
# By looking at a... Of the response object status_code attribute , Know whether the request is successful ( Status code 200 Indicates that the request was successful )
print("Status code:", r.status_code)
# take API The response is stored in a variable ( Will return json Format information is converted into python Dictionaries )
response_dict = r.json()
print("Total repositories:", response_dict['total_count']) # Check how many warehouses there are
# Explore information about the warehouse
repo_dicts = response_dict['items'] # Each and items All relevant dictionaries contain a reference to python Warehouse information
# print("Repositories returned:", len(repo_dicts)) # Check the information of how many warehouses you get
names, stars = [], []
for repo_dict in repo_dicts:
names.append(repo_dict['name'])
stars.append(repo_dict['stargazers_count'])
# visualization
my_style = LS # Use LightenStyle Class as Bar The basic format of
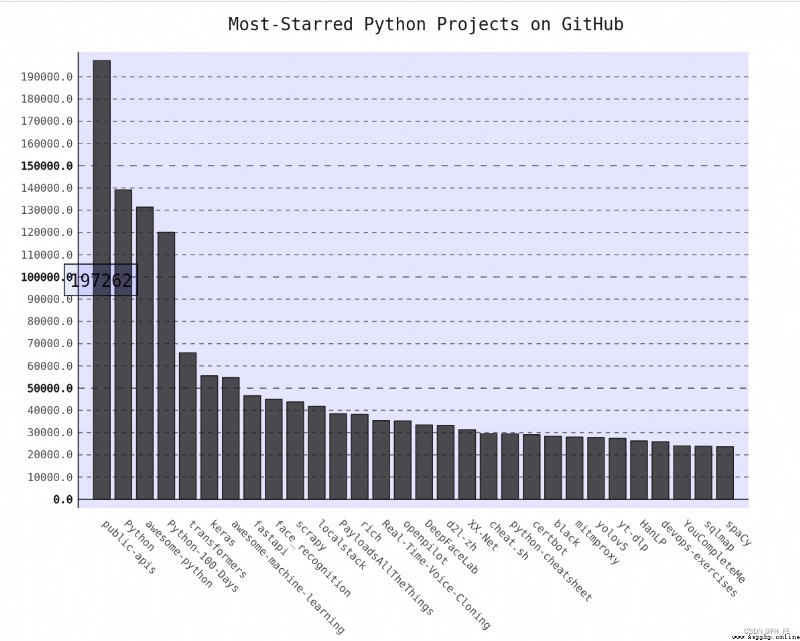
chart = pygal.Bar(style=my_style, x_label_rotation=45, show_legend=False) # Label wrapping x pivot 45 degree , And hide the legend
chart.title = 'Most-Starred Python Projects on GitHub'
chart.x_labels = names
chart.add('', stars) # When adding data , Set the label to an empty string
chart.render_to_file('python_repos.svg')
Open the generated... With a browser python_repos.svg
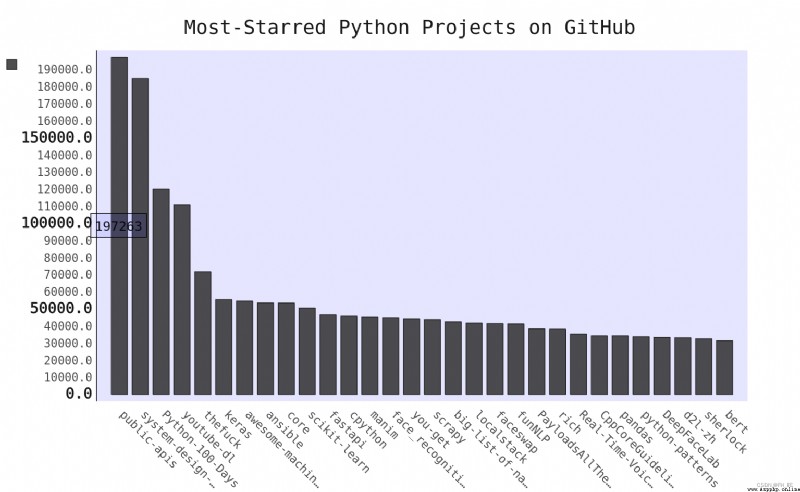
Set chart title , Font size of subtitles and main labels
Subtitle : x Name of the item on the axis , as well as y Most of the numbers on the axis
Main label : y On the shaft 5000 Integral multiple scale of
truncate_label: Shorten the longer project name to 15 Characters ( If you point to the truncated item name on the screen , The full project name will be explicitly )
show_y_guides: Set to False, To hide the horizontal line in the chart
import requests
import pygal
from pygal.style import LightColorizedStyle as LCS, LightStyle as LS
# perform API Call and store the response
url = 'https://api.github.com/search/repositories?q=language:python&sort=starts'
# take url Pass to r, Then store the response object in the variable r in
r = requests.get(url)
# By looking at a... Of the response object status_code attribute , Know whether the request is successful ( Status code 200 Indicates that the request was successful )
print("Status code:", r.status_code)
# take API The response is stored in a variable ( Will return json Format information is converted into python Dictionaries )
response_dict = r.json()
print("Total repositories:", response_dict['total_count']) # Check how many warehouses there are
# Explore information about the warehouse
repo_dicts = response_dict['items'] # Each and items All relevant dictionaries contain a reference to python Warehouse information
# print("Repositories returned:", len(repo_dicts)) # Check the information of how many warehouses you get
names, stars = [], []
for repo_dict in repo_dicts:
names.append(repo_dict['name'])
stars.append(repo_dict['stargazers_count'])
# visualization
my_style = LS # Use LightenStyle class , And set the tone to blue
my_config = pygal.Config() # Create a Pygal class Config Example
my_config.x_label_rotation = 45
my_config.show_legend = True
my_config.title_font_size = 24
my_config.label_font_size = 14
my_config.major_label_font_size = 18
my_config.truncate_label = 15
my_config.show_y_guides = False
my_config.width = 1000
chart = pygal.Bar(my_config, style=my_style) # Label wrapping x pivot 45 degree , And hide the legend
chart.title = 'Most-Starred Python Projects on GitHub'
chart.x_labels = names
chart.add('', stars) # When adding data , Set the label to an empty string
chart.render_to_file('python_repos.svg')

my_config.show_legend = False
Hide the legend 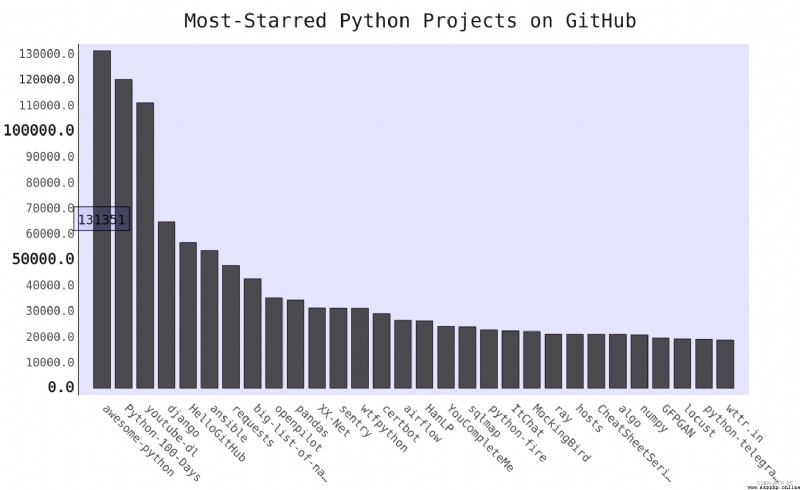
The tool tip : stay Pygal Point the mouse at the bar , The information it represents will be displayed
Now create a custom tooltip , To display the description of the item
bar_discriptions.py
import pygal
from pygal.style import LightColorizedStyle as LCS, LightStyle as LS
my_style = LS
chart = pygal.Bar(style=my_style, x_label_rotation=45, show_Legend=False)
chart.title = 'Python Projects'
chart.x_labels = ['httpie', 'django', 'flask']
plot_dicts = [
{
'value': 16101, 'label': 'Description of httpie.'},
{
'value':15028, 'label': 'Descripiton of django'},
{
'value': 14798, 'label': 'Description of flask'},
]
chart.add('', plot_dicts)
chart.render_to_file('bar_descriptions.svg')
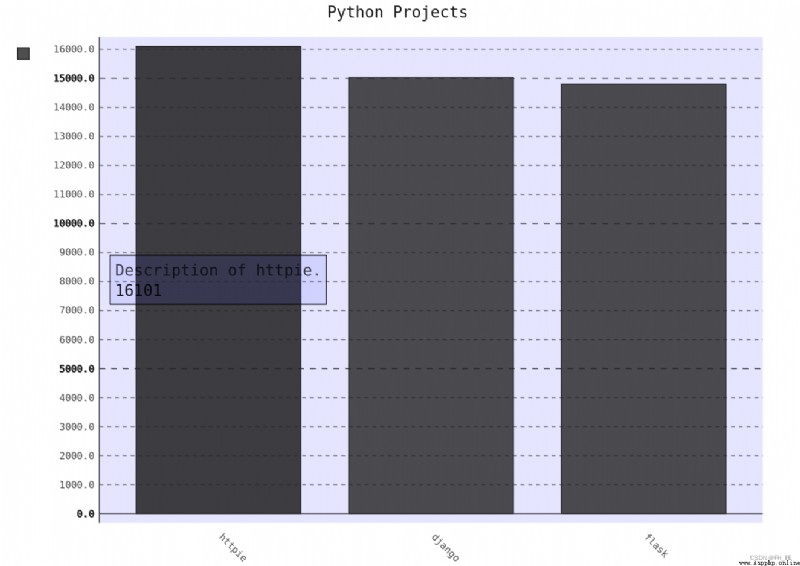
Automatic generation plot_dicts, It includes API Back to 30 A project
python_repos.py
# Explore information about the warehouse
repo_dicts = response_dict['items'] # Each and items All relevant dictionaries contain a reference to python Warehouse information
print("Number of items:", len(repo_dicts)) # Check the information of how many warehouses you get
names, plot_dicts = [], []
for repo_dict in repo_dicts:
names.append(repo_dict['name'])
plot_dict = {
'value': repo_dict['stargazers_count'], 'label': repo_dict['description']}
plot_dicts.append(plot_dict)
# visualization
my_style = LCS # Use LightenStyle class , And set the tone to blue
--snip--
chart = pygal.Bar(my_config, style=my_style) # Label wrapping x pivot 45 degree , And hide the legend
chart.title = 'Most-Starred Python Projects on GitHub'
chart.x_labels = names
chart.add('', plot_dicts) # When adding data , Set the label to an empty string
chart.render_to_file('python_repos_bar_descriptions.svg')
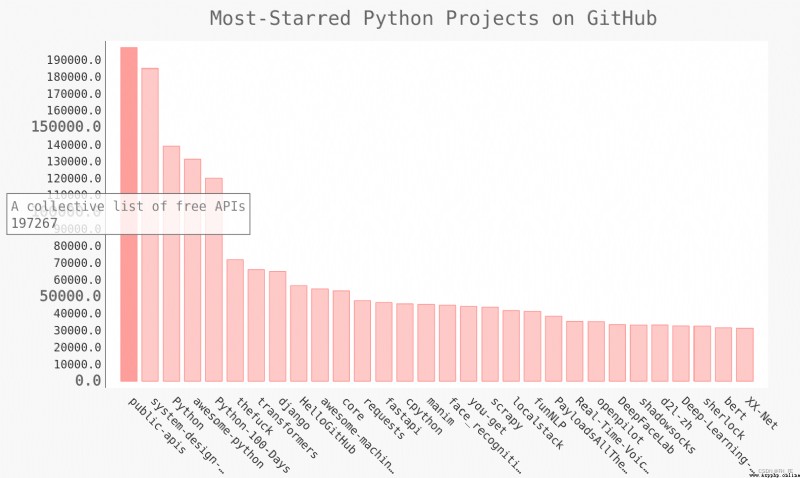
Pygal Allow each bar in the chart to be used as a link to the website , Just create a dictionary for each project , Add a key pair ‘xlink’:
python_repos.py
--snip--
names, plot_dicts = [], []
for repo_dict in repo_dicts:
names.append(repo_dict['name'])
plot_dict = {
'value': repo_dict['stargazers_count'],
'label': repo_dict['description'],
'xlink': repo_dict['html_url'],
}
plot_dicts.append(plot_dict)
--snip--
The chart opens , Then click on each bar , Will jump to the corresponding in the new window github Project address !
To explore how to use other websites API call , Let's see Hacker News(http://news.ycombinator.com/).
stay Hacker News Website , Users share articles on programming skills , And have an active discussion about it .Hacker News Of API Gives you access to information about all the articles and comments on the site , You are not required to register to obtain the key .
https://hacker-news.firebaseio.com/v0/item/9884165.json
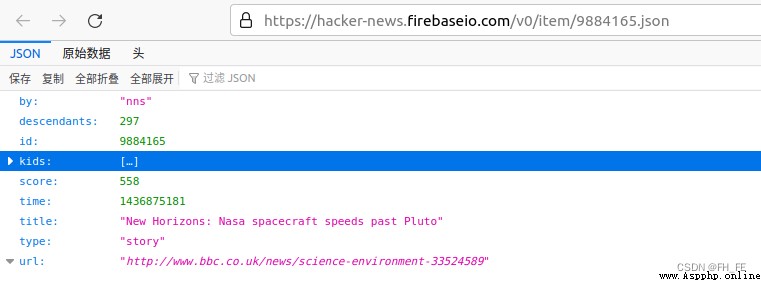
The response is a dictionary , contain ID by 9884165 Article information of
import requests
from operator import itemgetter
# perform API Call and store the response
url = 'https://hacker-news.firebaseio.com/v0/topstories.json'
r = requests.get(url) # Which includes Hacker News The most popular on the 500 Film article ID
print("Status code", r.status_code)
# Process information about each article
submission_ids = r.json()
submission_dicts = []
for submission_id in submission_ids[:30]:
# For each article , All execute one API call
url = ('https://hacker-news.firebaseio.com/v0/item/' + str(submission_id) + '.json')
submission_r = requests.get(url)
print(submission_r.status_code) # Judge whether the request status is successful
response_dict = submission_r.json()
submission_dict = {

'title': response_dict['title'],
'link': 'http://news.ycombinator.com/item?id=' + str(submission_id),
'comments': response_dict.get('descendants', 0) # When the number of comments is 0 when , There is no comments This one
}
submission_dicts.append(submission_dict)
submission_dicts = sorted(submission_dicts, key=itemgetter('comments'), reverse=True)
for submission_dict in submission_dicts:
print("\nTitle:", submission_dict['title'])
print("Discussion link:", submission_dict['link'])
print("Comments:", submission_dict['comments'])
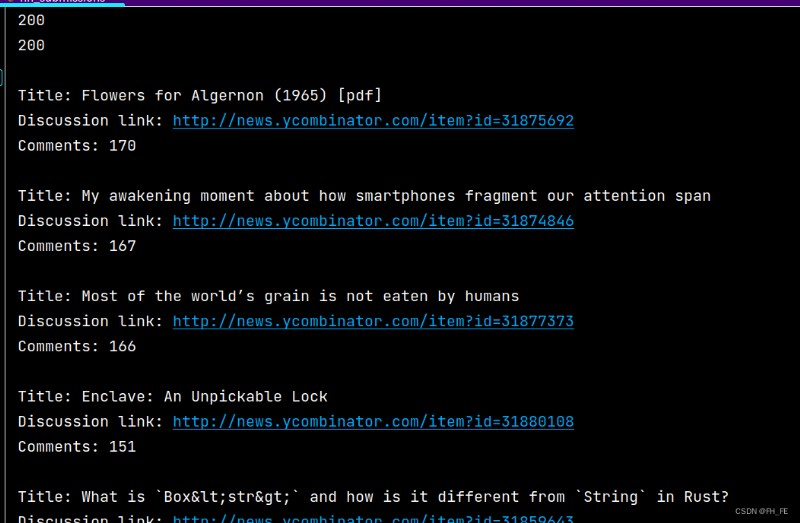
Use any API To access and analyze information , The process is similar . With the data , You can visualize the data .
 Cloud Computing Development: detailed explanation of python3 trigonometric function asin() method
describe Python3 asin() return
 Python+pytest automated test function test class test method encapsulation
Catalog Preface One 、 Genera