Preface
1. Problem description
2. Question why
4. resolvent
Conclusion
Preface This blog mainly solves the problem of using pandas When drawing an image and saving it , Because the label is too long , The labels on the coordinate axis are not displayed completely . When I first encountered a problem, I adjusted the size of the picture , But goose has no eggs , So I searched the question , Found no solution pandas Of . After unsuccessful query , Checked the official documents , aha , Isn't that what matplotlib Well , Change a keyword and then query , Sure enough , Namely . So this article is also applicable to solving matplotlib This problem occurs when drawing images .
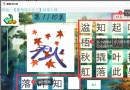
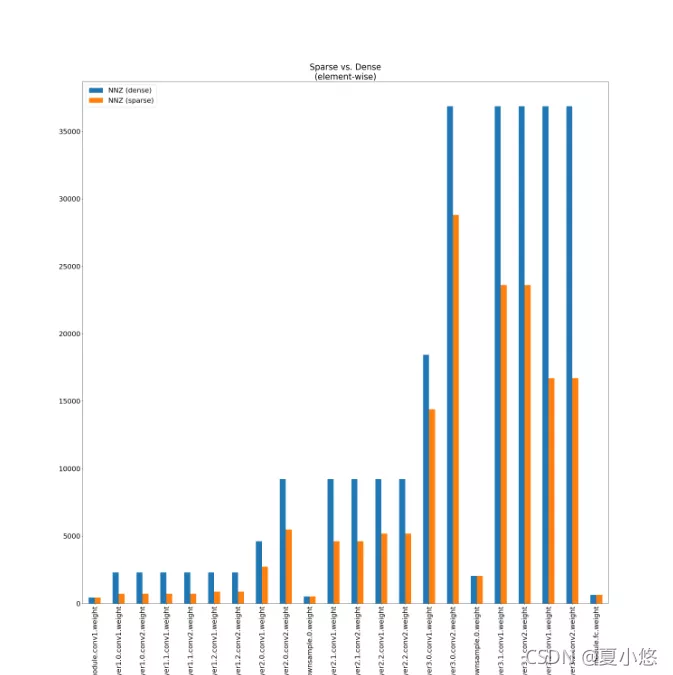
# Part of the code df_sparsity = distiller.weights_sparsity_summary(resnet20)df_sparsity_tmp = df_sparsity[['NNZ (dense)', 'NNZ (sparse)']]ax = df_sparsity_tmp.iloc[0:-1].plot(kind='bar', figsize=[30,10], title="Sparse vs. Dense\n(element-wise)")ax.set_xticklabels(df_sparsity.Name, rotation=90)fig = ax.get_figure()fig.savefig('output.png')1. Problem description Use pandas Of DataFrame Store data and draw images , The label of the abscissa axis is ResNet20 Each of them layer Name , image module.layer1.0.conv1.weight such , Because of too long , The resulting image is :
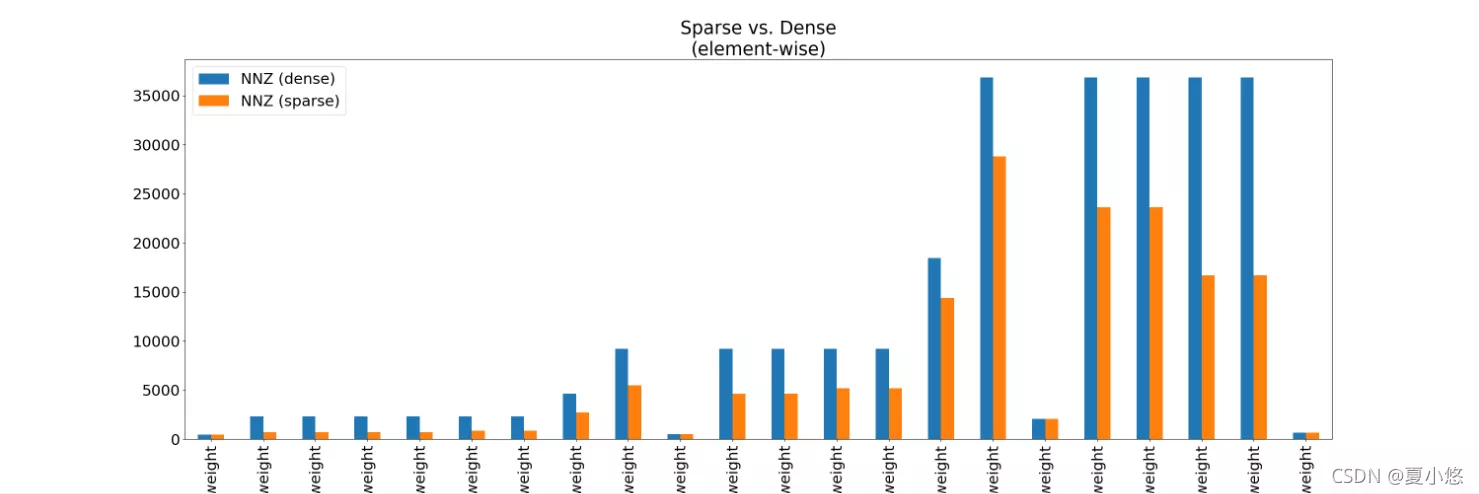
The label of the coordinate axis does not show all , So I try to change the size of the image :
# Change the lower height ax = df_sparsity_tmp.iloc[0:-1].plot(kind='bar', figsize=[30,50], title="Sparse vs. Dense\n(element-wise)")So the image becomes the following , Although it works , But the picture is stretched , Still unsightly :
Since the size of the drawn image is adjusted, the drawn image still does not meet the expectations , Then you can only look at the official documents ----pandas.DataFrame.plot(), See if there are other parameters , It can make the size and position of the image unchanged , The drawing space of the coordinate axis shall be adjusted properly . Then I found this :
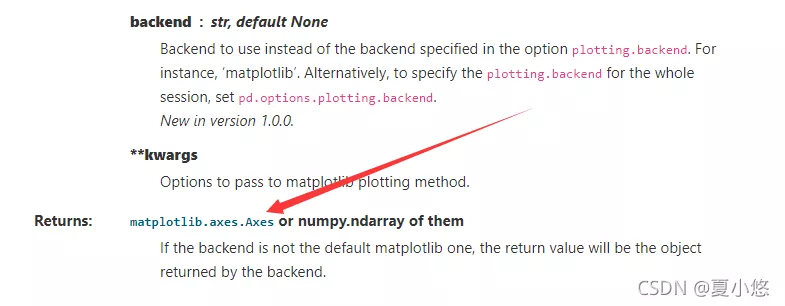
Function returns a matplotlib.axes.Axes, Since it is matlitplot, Then the problem is easy to solve ,matplotlib Always doing such things . Check it out. matplotlib Documents ----matplotlib.pyplot.savefig(), You can see :
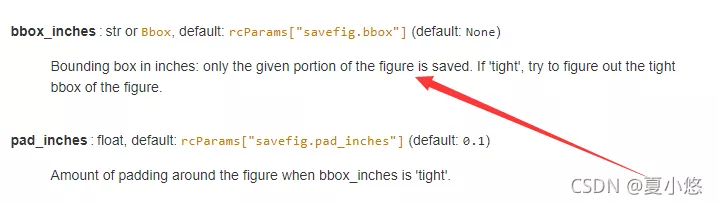
By default , Save only the given part of the drawing , If set to tight, Will try to save a tighter shape .
Add... When saving the drawing bbox_inches Parameters :
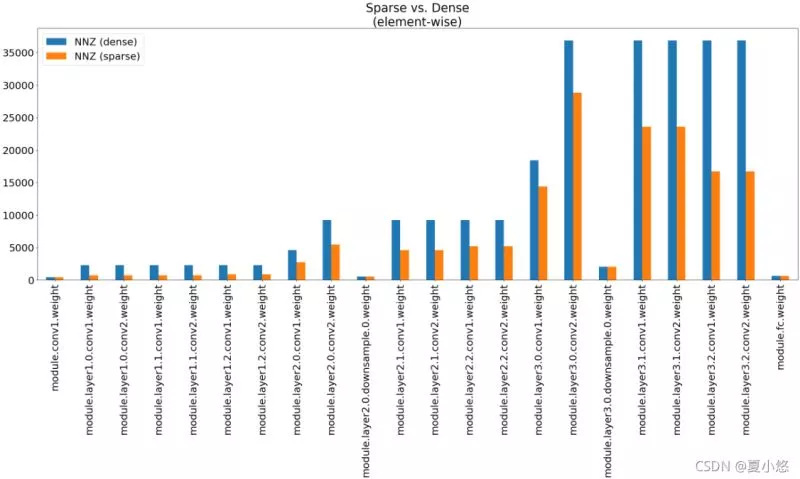
# Set up tight bboxfig.savefig('output.png', bbox_inches='tight')Save the drawing again , At this time, the ok 了 :
This is about Pandas Matplotlib This is the end of the article on how to solve the problem of incomplete display caused by too long coordinate axis labels when saving drawings , More about Pandas Matplotlib Please search the previous articles of the software development network or continue to browse the following related articles. I hope you can support the software development network in the future !