One 、matplotlib.pyplot.hist() grammar
Two 、 Draw histogram
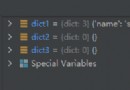
① Draw a simple histogram
②: Histogram drawn by each parameter
(1)histtype Parameters ( Set the style bar、barstacked、step、stepfilled)
(2)range Parameters ( Specify the upper and lower bounds of histogram data , The default contains the maximum and minimum values of plot data ( Range ))
(3)orientation Parameters ( Set the placement of histogram ,vertical vertical direction horizontal horizontal direction , The default value is :vertical vertical direction )
(4)density Parameters (bool value ,True: Convert coordinate axis to density scale , The default value is :None)
(5)weights Parameters ( Set the weight for each data point )
(6)cumulative Parameters (bool value , Whether it is necessary to calculate the cumulative frequency or frequency , The default value is :False)
(7)bottom Parameters ( Add baseline to histogram )
(8)align Parameters ( Set the alignment of bar boundary values ,mid、left、right, The default value is :mid)
(9)rwidth Parameters ( Set the percentage of histogram bar width )
(10)log Parameters (bool value , To plot data log Transformation The default value is :False)
(11)stacked Parameters (bool value , When there are multiple data , Whether it is necessary to stack the histograms , The default value is :False Horizontal )
(12) Display all parameters of histogram :
3、 ... and 、 Draw a line chart on the histogram
summary
One 、matplotlib.pyplot.hist() grammarhist(x, bins=None, range=None, density=False,weights=None, cumulative=False, bottom=None, histtype='bar', align='mid', orientation='vertical', rwidth=None, log=False, color=None, label=None, stacked=False, *, data=None, **kwargs)plt.hist( x,# Specify the data to draw the histogram bins,# Set the number of long bars range,# Specify the upper and lower bounds of histogram data , The default contains the maximum and minimum values of plot data ( Range ) density=True or False, # If "True", take y The axis is converted to a density scale The default is None weights,# This parameter can set the weight for each data point cumulative=True or False,# Whether it is necessary to calculate the cumulative frequency or frequency The default value is False bottom=0, # You can add a baseline to each bar of the histogram , The default is 0 histtype={'bar', 'barstacked', 'step', 'stepfilled'} # Set the style # bar Column data side by side , The default value is . # barstacked In the column data overlap side by side ( The same together ) # step Columnar color does not fill # stepfilled Filled linear align='mid' or 'left' or 'right', # Set the alignment of bar boundary values , The default is mid, In addition to that 'left' and 'right' orientation={'vertical', 'horizontal'},# Set the placement direction of histogram , The default is vertical direction vertical rwidth,# Set the percentage of histogram bar width log=True or False,# Whether the drawing data needs to be log Transformation The default value is False color='r',# Set the fill color of the histogram label, # Set the label of histogram stacked=True or False, # When there are multiple data , Whether it is necessary to stack the histograms , Default False Horizontal ; facecolor,# Set bar color ( and color The effect is consistent , Set up color You don't have to set facecolor) edgecolor,# Set the color of the border alpha # Set transparency )# Pay attention to group spacing , Get a satisfactory display effect # Be careful y Is the variable represented by the axis frequency or frequency Two 、 Draw histogram ① Draw a simple histogram import matplotlib.pyplot as pltimport numpy as npdata=np.random.randint(140,180,200)# bins Set the number of long bars plt.hist(data,bins=10)plt.show()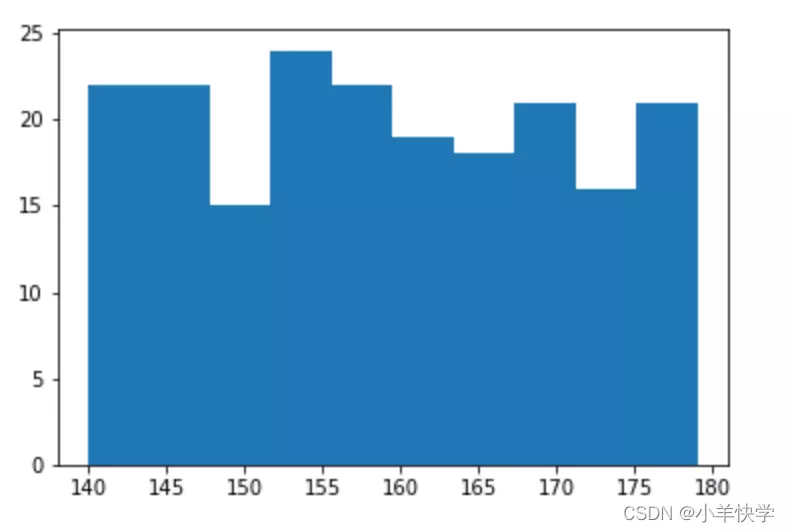
1. bar: Column data side by side ( because bar Is the default value , Don't write )
import matplotlib.pyplot as pltimport numpy as npdata=np.random.randint(140,180,200)plt.hist(data,bins=10)plt.show()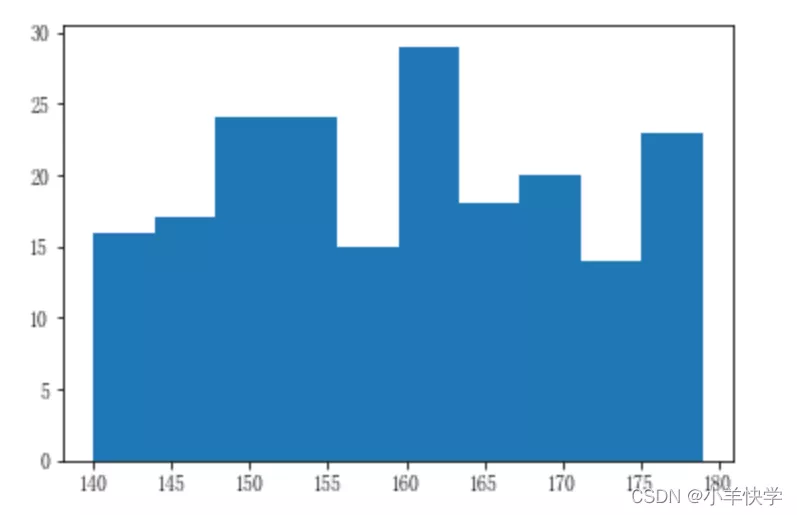
2. barstacked: In the column data overlap side by side ( The same together )
import matplotlib.pyplot as pltimport numpy as npdata=np.random.randint(140,180,200)plt.hist(data,bins=10,histtype='barstacked')plt.show()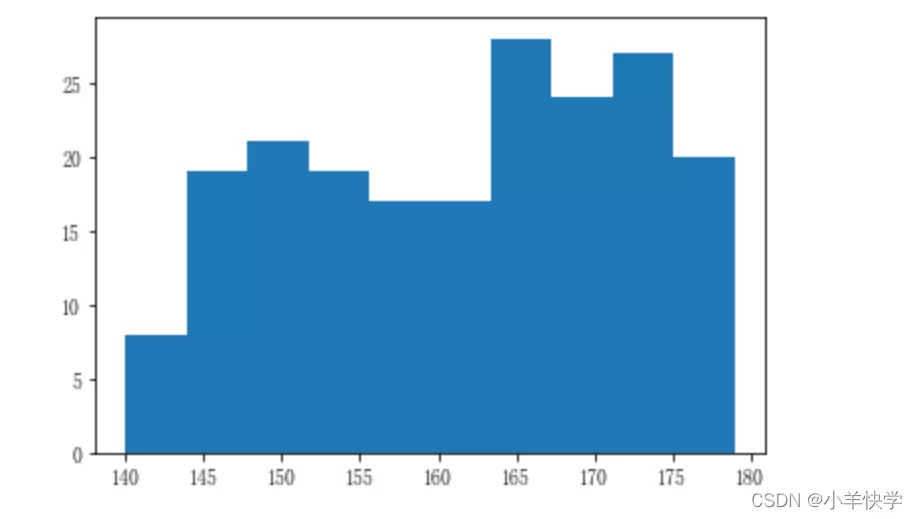
3. step: Columnar color does not fill
import matplotlib.pyplot as pltimport numpy as npdata=np.random.randint(140,180,200)plt.hist(data,bins=10,histtype='step')plt.show()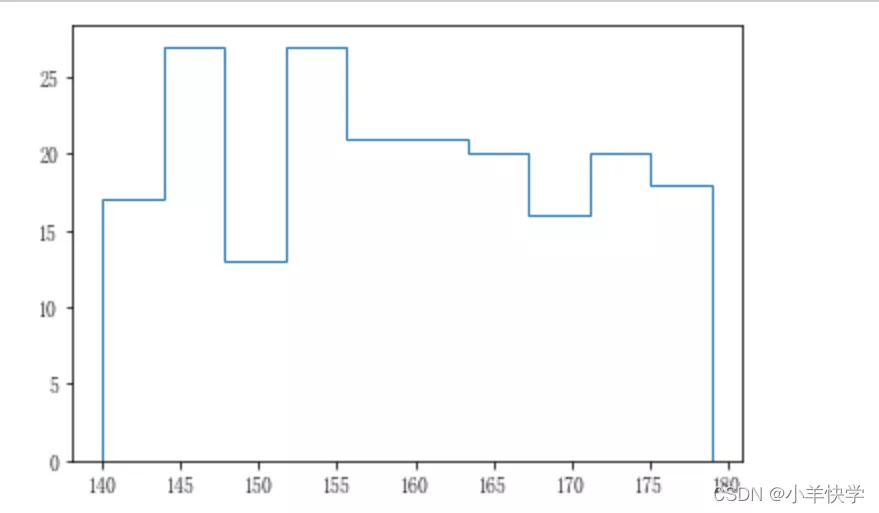
4. stepfilled: Generate a default filled line diagram
import matplotlib.pyplot as pltimport numpy as npdata=np.random.randint(140,180,200)plt.hist(data,bins=10,histtype='stepfilled')plt.show()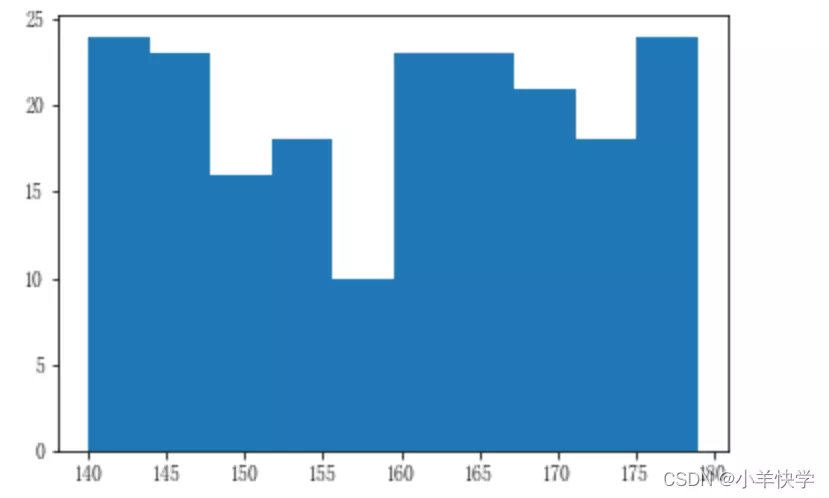
Do not want to display the full range of data , You only want to view data within a certain range .( example : The data range in the following figure is 140~180 Between , Just want to see 150~170 Data between )
import matplotlib.pyplot as pltimport numpy as npdata=np.random.randint(140,180,200)plt.hist(data,bins=10,histtype='bar',range=(150,170))plt.show()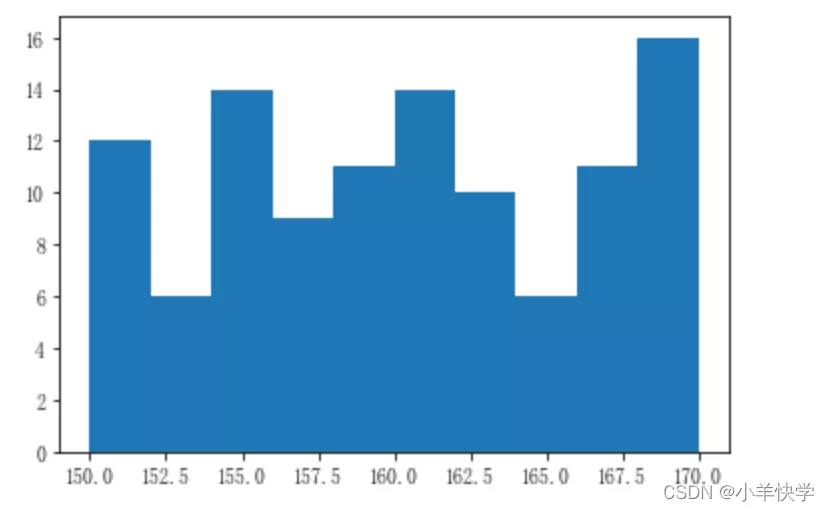
vertical direction ( Default vertical , Don't write ):
import matplotlib.pyplot as pltimport numpy as npdata=np.random.randint(140,180,200)plt.hist(data,bins=10)plt.show()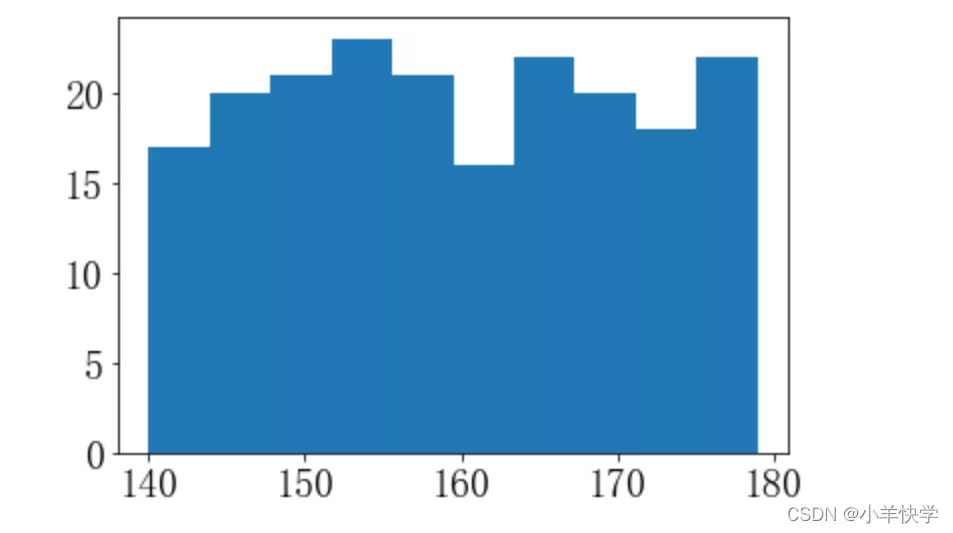
horizontal horizontal direction :
import matplotlib.pyplot as pltimport numpy as npdata=np.random.randint(140,180,200)plt.hist(data,bins=10,orientation='horizontal')plt.show()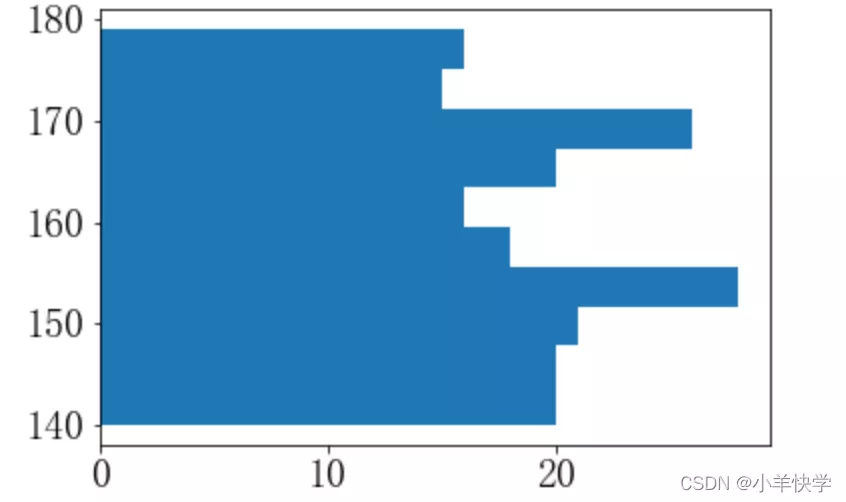
When the histogram is vertical , Observe y Axis :
import matplotlib.pyplot as pltimport numpy as npdata=np.random.randint(140,180,200)plt.hist(data,bins=10,density=True)plt.show()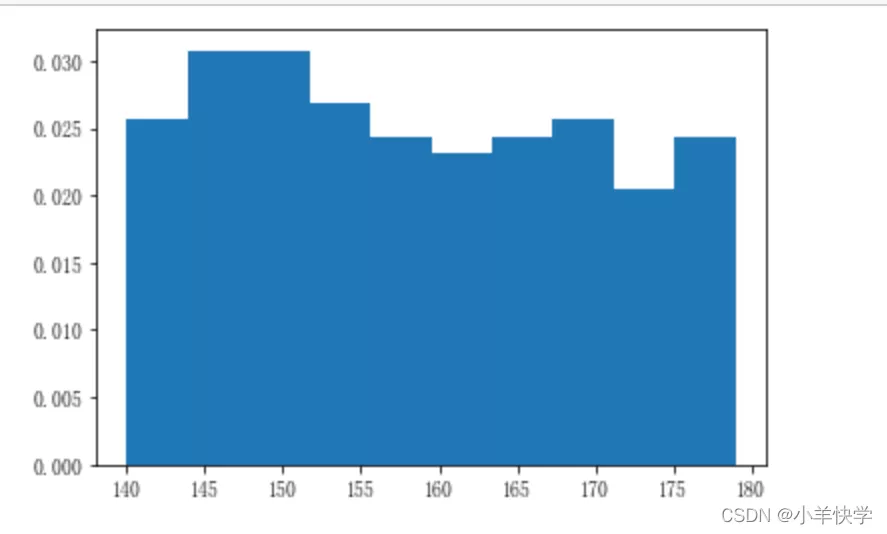
When the histogram is horizontal , Observe x Axis :
import matplotlib.pyplot as pltimport numpy as npdata=np.random.randint(140,180,200)plt.hist(data,bins=10,orientation='horizontal',density=True)plt.show()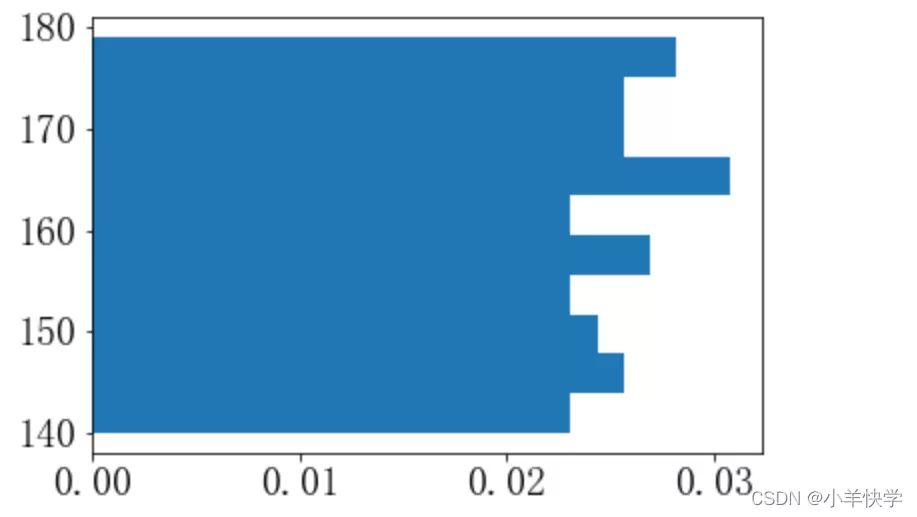
When the histogram is vertical , Observe y Axis :
import matplotlib.pyplot as pltimport numpy as npdata=np.random.randint(140,180,200)plt.hist(data,bins=10,weights=data)plt.show()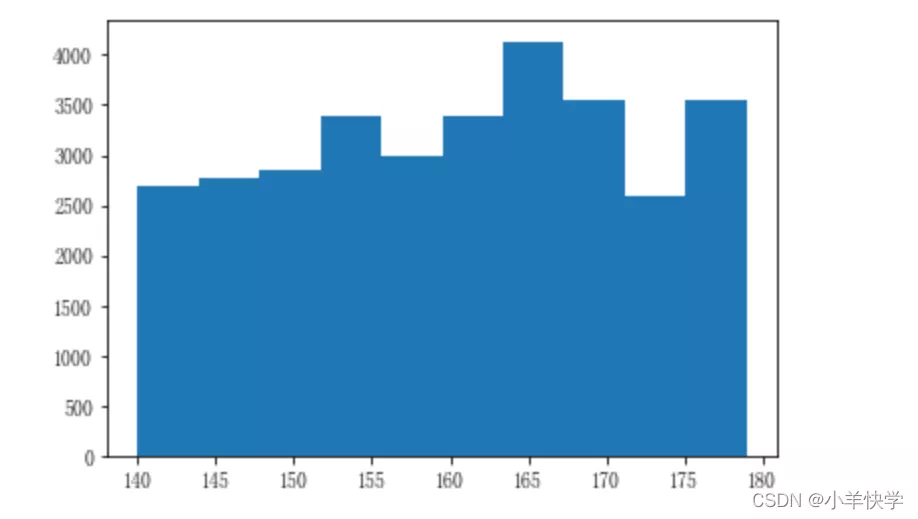
When the histogram is horizontal , Observe x Axis :
import matplotlib.pyplot as pltimport numpy as npdata=np.random.randint(140,180,200)plt.hist(data,bins=10,orientation='horizontal',weights=data)plt.show()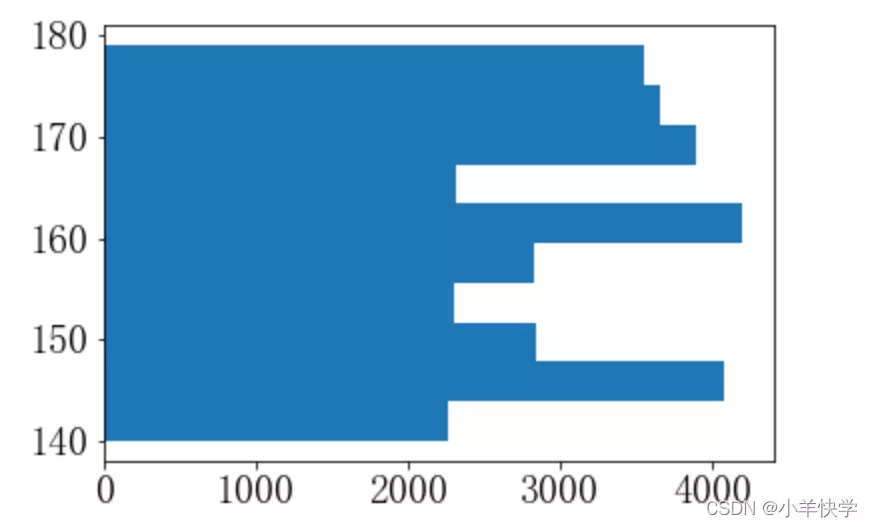
frequency : It refers to the number of times the event occurs
frequency : It refers to the number of times in the total number of times n The proportion of
frequency = frequency /n
When the histogram is vertical :
import matplotlib.pyplot as pltimport numpy as npdata=np.random.randint(140,180,200)plt.hist(data,bins=10,cumulative=True)plt.show()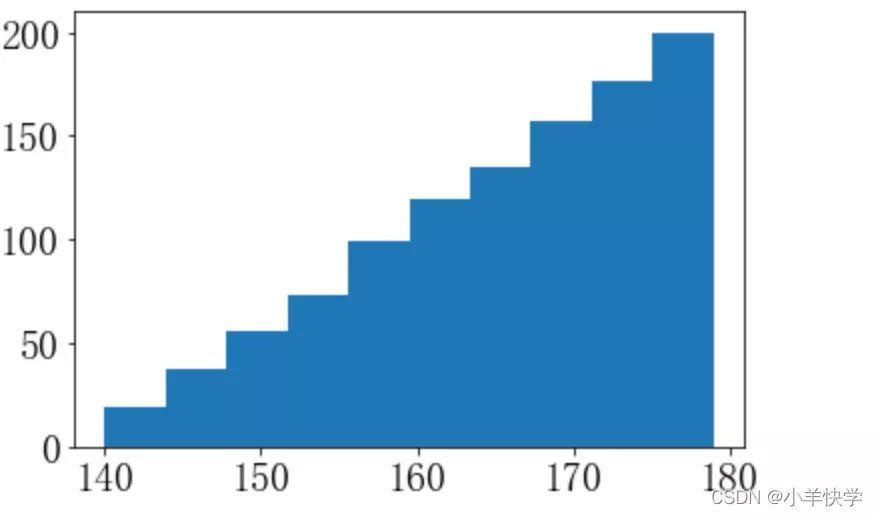
When the histogram is horizontal :
import matplotlib.pyplot as pltimport numpy as npdata=np.random.randint(140,180,200)plt.hist(data,bins=10,orientation='horizontal',cumulative=True)plt.show()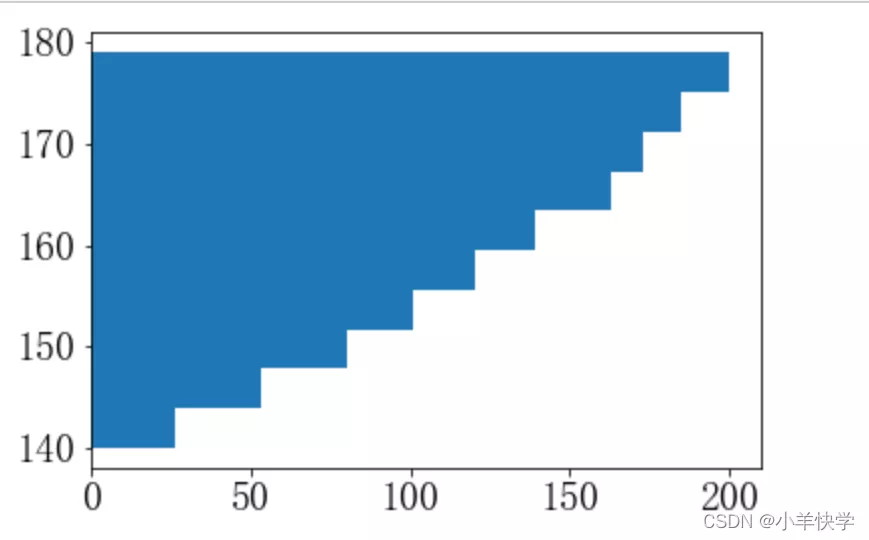
When the histogram is vertical , Observe y Axis :
import matplotlib.pyplot as pltimport numpy as npdata=np.random.randint(140,180,200)plt.hist(data,bins=10,bottom=170)plt.show()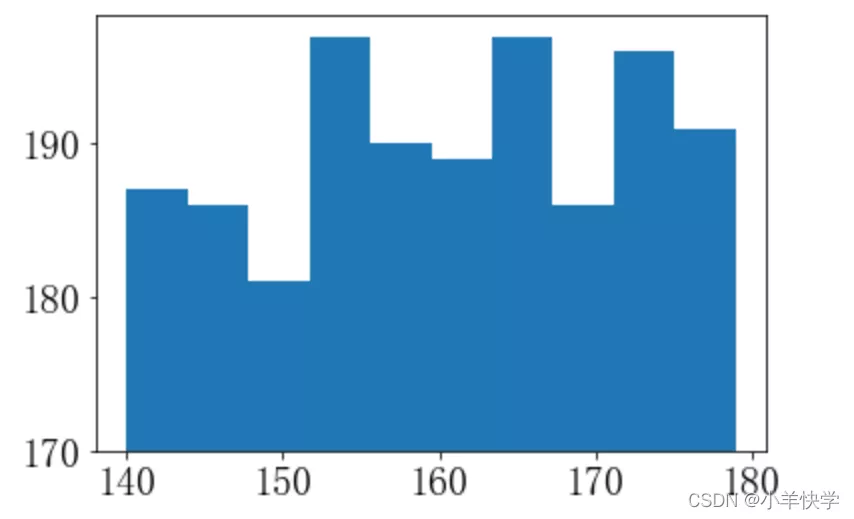
When the histogram is horizontal , Observe x Axis :
import matplotlib.pyplot as pltimport numpy as npdata=np.random.randint(140,180,200)plt.hist(data,bins=10,orientation='horizontal',bottom=170)plt.show()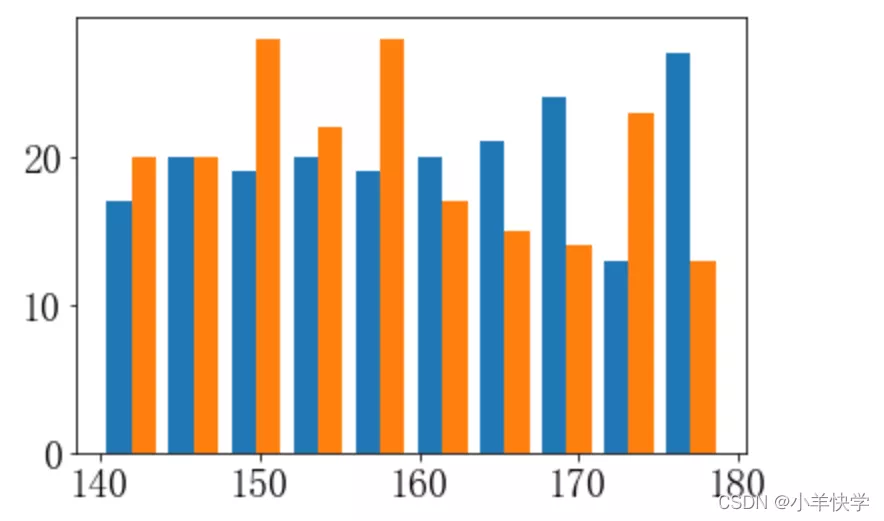
mid( The default value can be left blank ):
import matplotlib.pyplot as pltimport numpy as npdata=np.random.randint(140,180,200)plt.hist(data,bins=10)plt.show()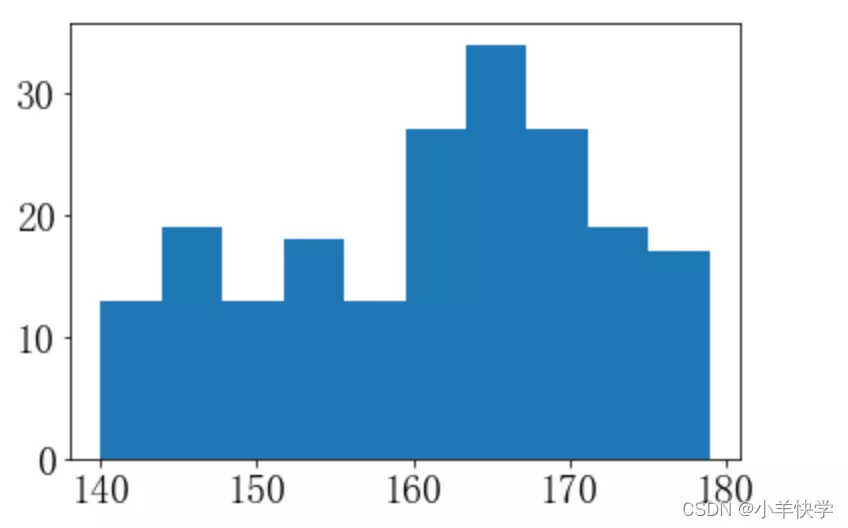
left:
import matplotlib.pyplot as pltimport numpy as npdata=np.random.randint(140,180,200)plt.hist(data,bins=10,align='left')plt.show()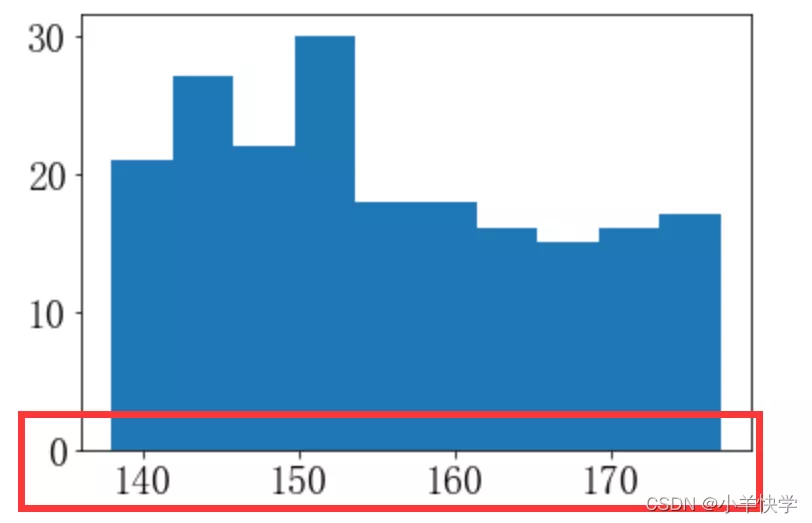
right:
import matplotlib.pyplot as pltimport numpy as npdata=np.random.randint(140,180,200)plt.hist(data,bins=10,align='right')plt.show()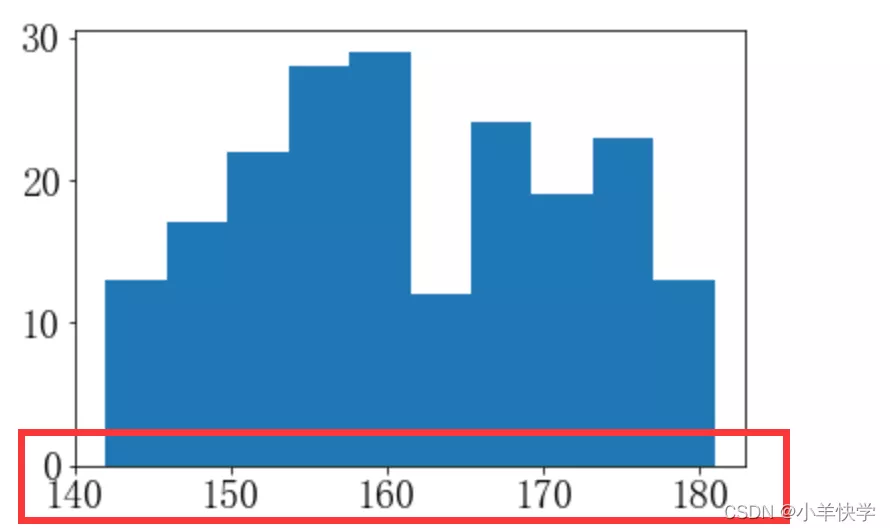
import matplotlib.pyplot as pltimport numpy as npdata=np.random.randint(140,180,200)plt.hist(data,bins=10,rwidth=0.5)plt.show()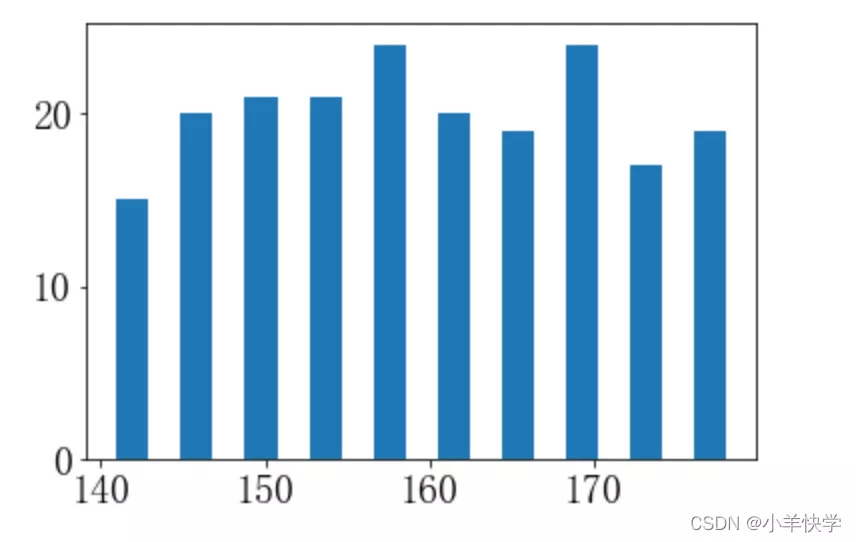
When the histogram is vertical , Observe y Axis :
import matplotlib.pyplot as pltimport numpy as npdata=np.random.randint(140,180,200)plt.hist(data,bins=10,log=True)plt.show()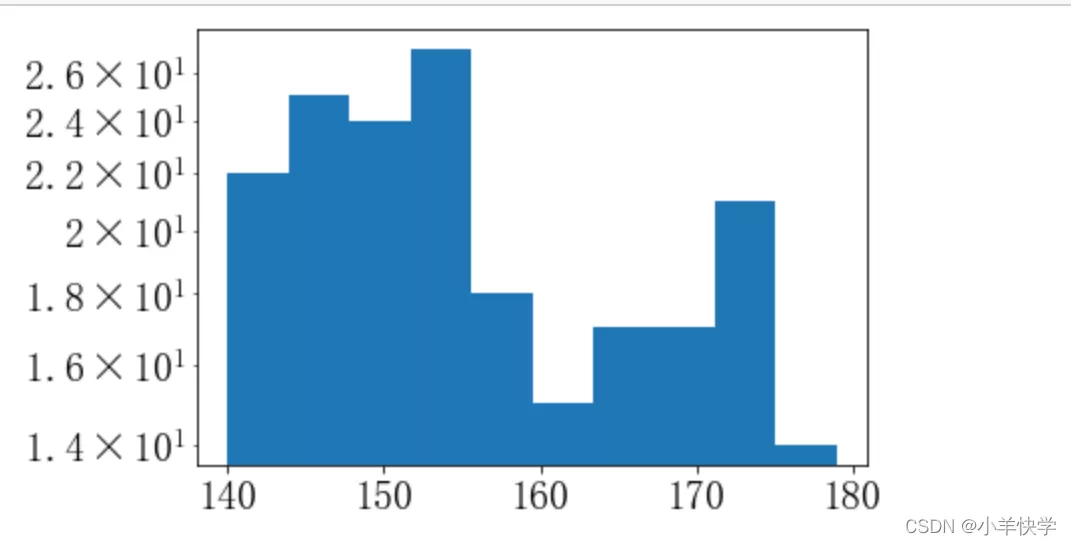
When the histogram is horizontal , Observe x Axis :
import matplotlib.pyplot as pltimport numpy as npdata=np.random.randint(140,180,200)plt.hist(data,bins=10,orientation='horizontal',log=True)plt.show()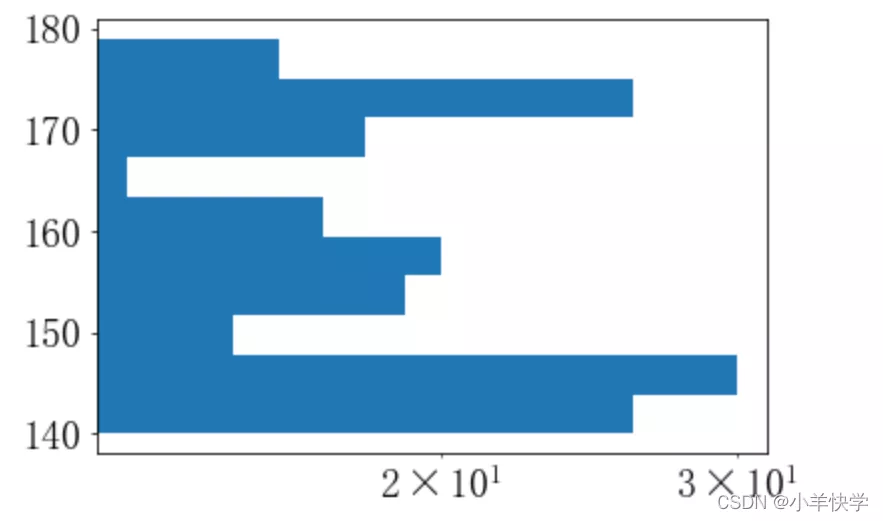
stacked=False when :( Horizontal )
import matplotlib.pyplot as pltimport numpy as npx=np.random.randint(140,180,200)y=np.random.randint(140,180,200)plt.hist([x,y], bins=10)plt.show()
stacked=True when :( Stacking )
import matplotlib.pyplot as pltimport numpy as npx=np.random.randint(140,180,200)y=np.random.randint(140,180,200)plt.hist([x,y], bins=10,stacked=True)plt.show()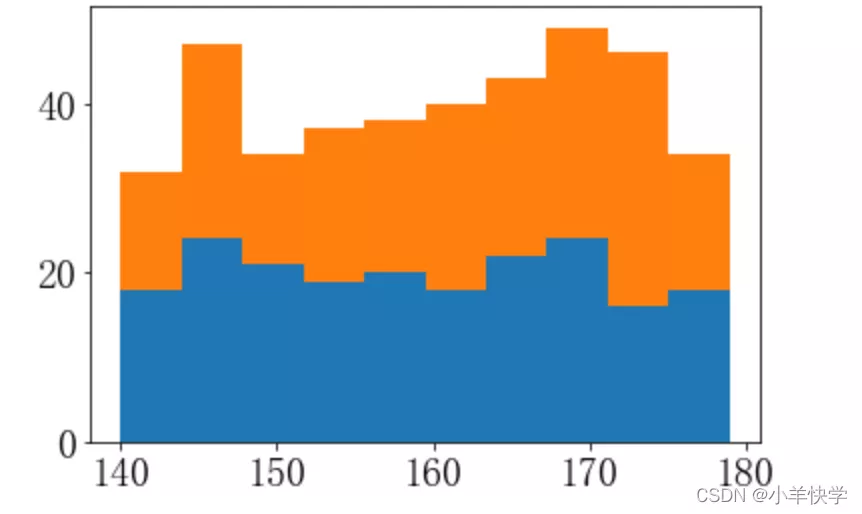
import matplotlib.pyplot as pltimport numpy as npplt.rcParams['font.sans-serif']=['FangSong']fig=plt.figure(figsize=(8,8))data=np.random.randint(140,180,200)# data data # bins Set the number of long strips # histtype Set the style barstacked: In the column data overlap side by side ( The same together )# range Display range # cumulative Cumulative frequency # align Set the boundary alignment value to center alignment # orientation Set the placement direction to horizontal horizontal direction # rwidth Set the percentage of strip width to 20# color Set the fill color of the strip to #FFB6C1# label Set the label of histogram # edgecolor Set the long border line to #FFD700# alpha Set the transparency of the bar to 0.5# density=True The strip is horizontal :density take x The axis is converted to a density scale The strip is vertical :density take y The axis is converted to a density scale # weights=data Set the weight for each data point # bottom Set the baseline to 15000# log=True Whether the data is log transformation plt.hist(data,bins=10,histtype='barstacked',range=(140,170),cumulative=True,align='mid',orientation='horizontal',rwidth=20,color='#FFB6C1', label=' Number ',edgecolor='#FFD700',alpha=0.5,weights=data,bottom=10000,log=False)plt.xticks(size=20) # x Axis scale value size plt.yticks(size=20) # y Axis scale value size plt.title('hist',size=30) # Set histogram labels plt.xlabel('x Axis ',size=15) # Set up x Axis labels plt.ylabel('y Axis ',size=20) # Set up y Axis labels plt.rcParams.update({'font.size':20}) # Change the legend font size plt.legend()plt.show()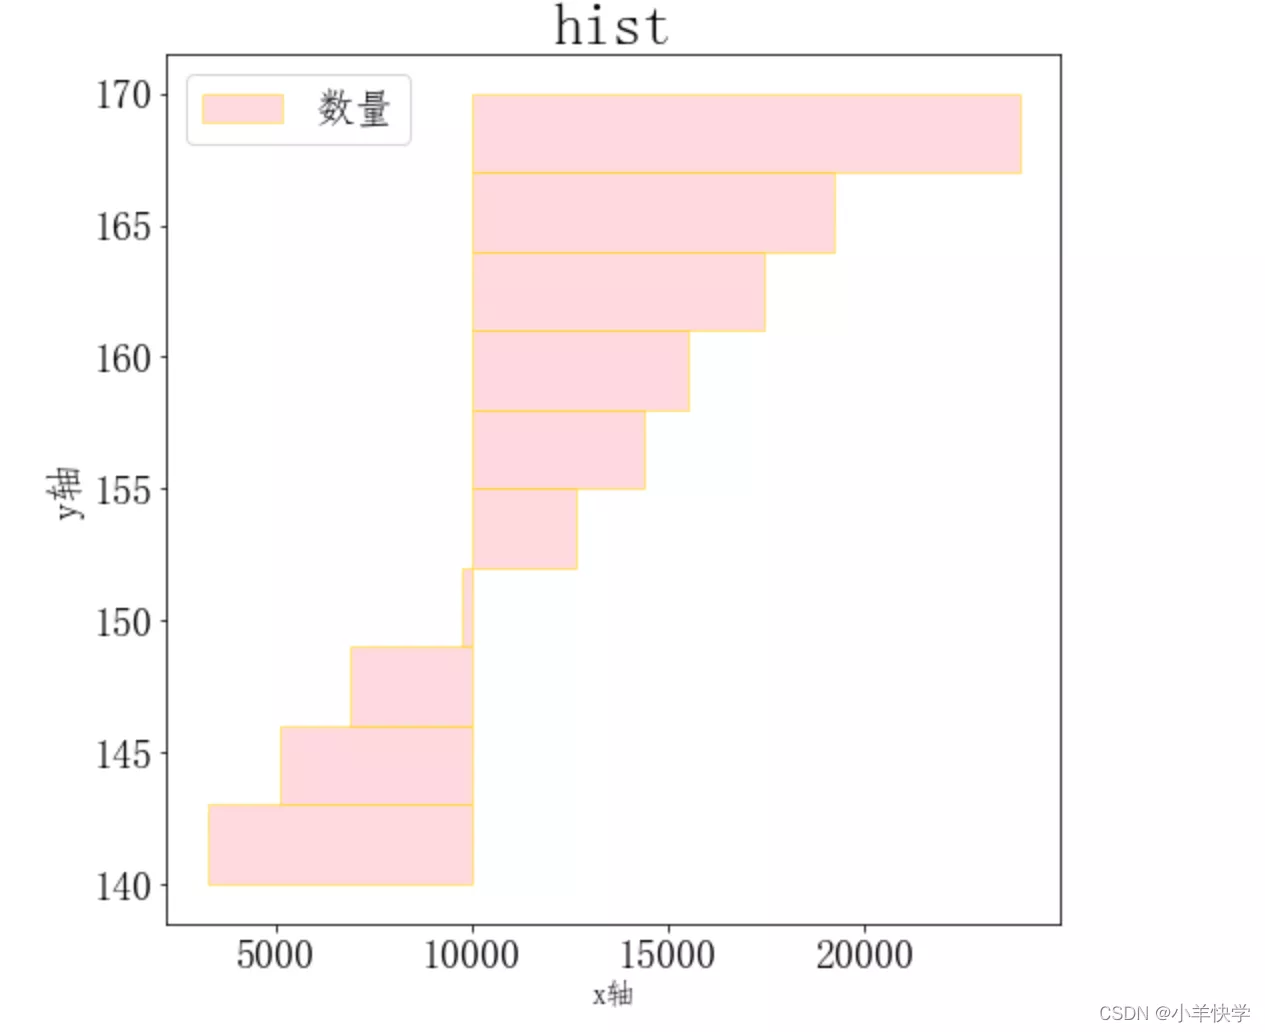
import matplotlib.pyplot as pltimport numpy as npx=np.random.normal(100,15,10000)y=np.random.normal(80,15,10000)# density=True Set to density scale n1, bins1, patches1 = plt.hist(x, bins=50, density=True, color='#00B8B8', alpha=1)n2, bins2, patches2 = plt.hist(y, bins=50, density=True, color='r', alpha=0.2)plt.plot(bins1[:-1],n1,':',lw=3)plt.plot(bins2[:-1],n2,'--',lw=3)plt.show()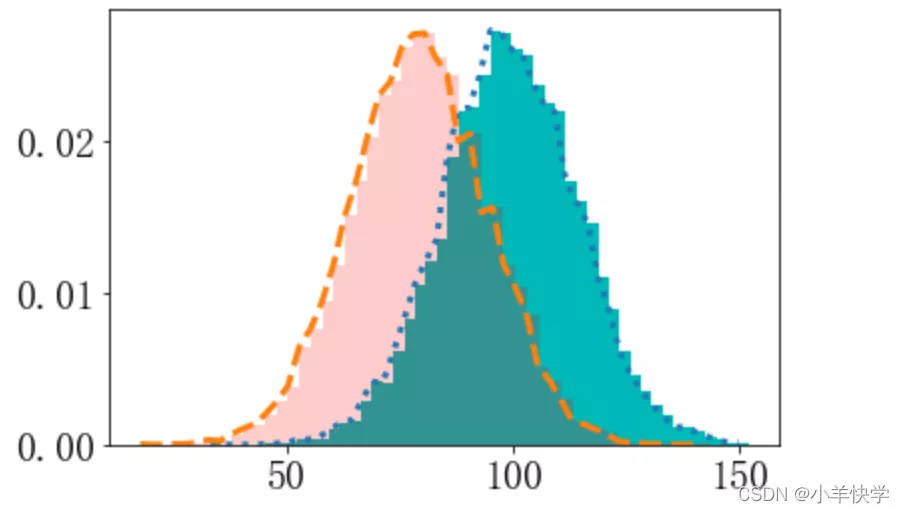
This is about Python matplotlib.pyplot.hist() This is the end of the histogram drawing article , More about matplotlib.pyplot.hist() To draw the histogram content, please search the previous articles of software development network or continue to browse the relevant articles below. I hope you can support software development network more in the future !