這篇文章主要介紹“python怎麼實現圖像簡單濾波”的相關知識,小編通過實際案例向大家展示操作過程,操作方法簡單快捷,實用性強,希望這篇“python怎麼實現圖像簡單濾波”文章能幫助大家解決問題。
對圖像進行濾波,可以有兩種效果:一種是平滑濾波,用來抑制噪聲;另一種是微分算子,可以用來檢測邊緣和特征提取。
skimage庫中通過filters模塊進行濾波操作。
sobel算子可用來檢測邊緣
函數格式為:skimage.filters.sobel(image, mask=None)
from skimage import data,filtersimport matplotlib.pyplot as pltimg = data.camera()edges = filters.sobel(img)plt.imshow(edges,plt.cm.gray)
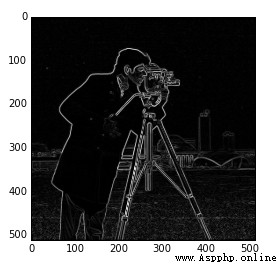
roberts算子和sobel算子一樣,用於檢測邊緣
調用格式也是一樣的:
edges = filters.roberts(img)
功能同sobel,調用格式:
edges = filters.scharr(img)
功能同sobel,調用格式:
edges = filters.prewitt(img)
canny算子也是用於提取邊緣特征,但它不是放在filters模塊,而是放在feature模塊
函數格式:skimage.feature.canny(image,sigma=1.0)
可以修改sigma的值來調整效果
from skimage import data,filters,featureimport matplotlib.pyplot as pltimg = data.camera()edges1 = feature.canny(img) #sigma=1edges2 = feature.canny(img,sigma=3) #sigma=3plt.figure('canny',figsize=(8,8))plt.subplot(121)plt.imshow(edges1,plt.cm.gray) plt.subplot(122)plt.imshow(edges2,plt.cm.gray)plt.show()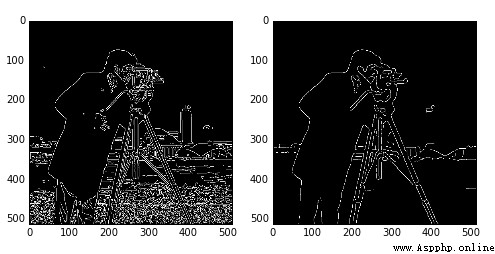
從結果可以看出,sigma越小,邊緣線條越細小。
gabor濾波可用來進行邊緣檢測和紋理特征提取。
函數調用格式:skimage.filters.gabor_filter(image, frequency)
通過修改frequency值來調整濾波效果,返回一對邊緣結果,一個是用真實濾波核的濾波結果,一個是想象的濾波核的濾波結果。

from skimage import data,filtersimport matplotlib.pyplot as pltimg = data.camera()filt_real, filt_imag = filters.gabor_filter(img,frequency=0.6) plt.figure('gabor',figsize=(8,8))plt.subplot(121)plt.title('filt_real')plt.imshow(filt_real,plt.cm.gray) plt.subplot(122)plt.title('filt-imag')plt.imshow(filt_imag,plt.cm.gray)plt.show()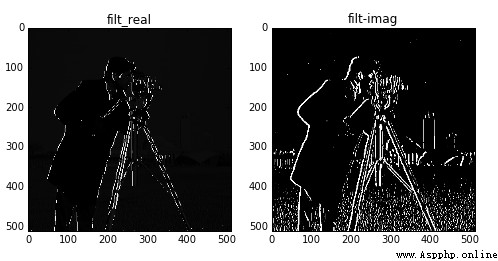
以上為frequency=0.6的結果圖。
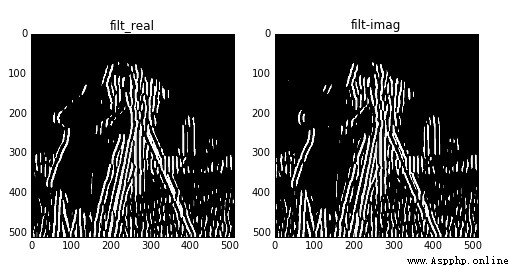
以上為frequency=0.1的結果圖
多維的濾波器,是一種平滑濾波,可以消除高斯噪聲。
調用函數為:skimage.filters.gaussian_filter(image, sigma)
通過調節sigma的值來調整濾波效果
from skimage import data,filtersimport matplotlib.pyplot as pltimg = data.astronaut()edges1 = filters.gaussian_filter(img,sigma=0.4) #sigma=0.4edges2 = filters.gaussian_filter(img,sigma=5) #sigma=5plt.figure('gaussian',figsize=(8,8))plt.subplot(121)plt.imshow(edges1,plt.cm.gray) plt.subplot(122)plt.imshow(edges2,plt.cm.gray)plt.show()
可見sigma越大,過濾後的圖像越模糊
中值濾波,一種平滑濾波,可以消除噪聲。
需要用skimage.morphology模塊來設置濾波器的形狀。
from skimage import data,filtersimport matplotlib.pyplot as pltfrom skimage.morphology import diskimg = data.camera()edges1 = filters.median(img,disk(5))edges2= filters.median(img,disk(9))plt.figure('median',figsize=(8,8))plt.subplot(121)plt.imshow(edges1,plt.cm.gray) plt.subplot(122)plt.imshow(edges2,plt.cm.gray)plt.show()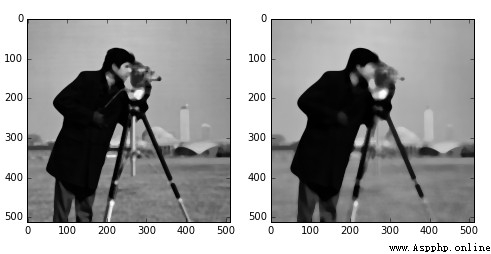
從結果可以看出,濾波器越大,圖像越模糊。
上邊所舉的例子都是進行全部邊緣檢測,有些時候我們只需要檢測水平邊緣,或垂直邊緣,就可用下面的方法。
水平邊緣檢測:sobel_h, prewitt_h, scharr_h
垂直邊緣檢測: sobel_v, prewitt_v, scharr_v
from skimage import data,filtersimport matplotlib.pyplot as pltimg = data.camera()edges1 = filters.sobel_h(img) edges2 = filters.sobel_v(img) plt.figure('sobel_v_h',figsize=(8,8))plt.subplot(121)plt.imshow(edges1,plt.cm.gray) plt.subplot(122)plt.imshow(edges2,plt.cm.gray)plt.show()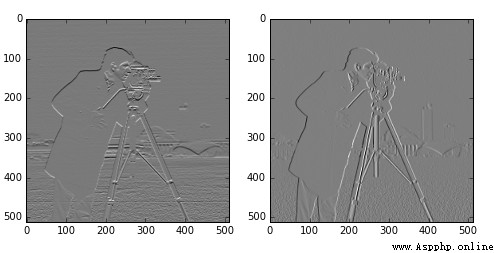
上邊左圖為檢測出的水平邊緣,右圖為檢測出的垂直邊緣。
可使用Roberts的十字交叉核來進行過濾,以達到檢測交叉邊緣的目的。這些交叉邊緣實際上是梯度在某個方向上的一個分量。
其中一個核:
0 1
-1 0
對應的函數:
roberts_neg_diag(image)
例:
from skimage import data,filtersimport matplotlib.pyplot as pltimg =data.camera()dst =filters.roberts_neg_diag(img) plt.figure('filters',figsize=(8,8))plt.subplot(121)plt.title('origin image')plt.imshow(img,plt.cm.gray)plt.subplot(122)plt.title('filted image')plt.imshow(dst,plt.cm.gray)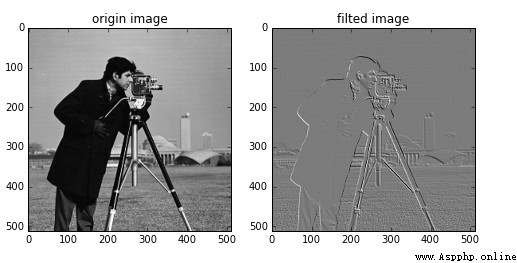
另外一個核:
1 0
0 -1
對應函數為:
roberts_pos_diag(image)
from skimage import data,filtersimport matplotlib.pyplot as pltimg =data.camera()dst =filters.roberts_pos_diag(img) plt.figure('filters',figsize=(8,8))plt.subplot(121)plt.title('origin image')plt.imshow(img,plt.cm.gray)plt.subplot(122)plt.title('filted image')plt.imshow(dst,plt.cm.gray)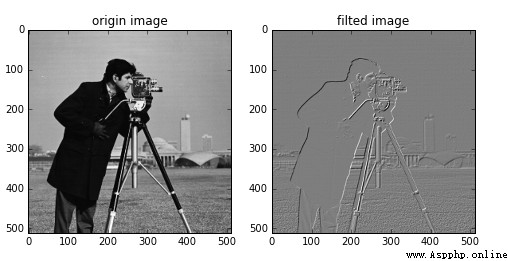
關於“python怎麼實現圖像簡單濾波”的內容就介紹到這裡了,感謝大家的閱讀。如果想了解更多行業相關的知識,可以關注億速雲行業資訊頻道,小編每天都會為大家更新不同的知識點。