Datawhale dried food
author : Geng Yuanhao ,Datawhale member , East China Normal University
Classified data (categorical data) It is the data reflecting the type of things obtained by classifying or grouping phenomena according to certain attributes , Also known as categorical data . To put it bluntly , Is that the value is limited , Or a fixed number of possible values . for example : Gender 、 Blood type, etc .
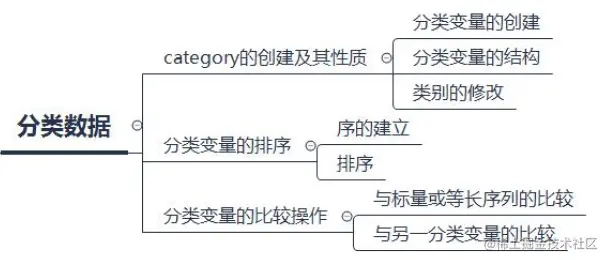
today , Let's learn ,Pandas How to deal with classified data . It mainly focuses on the following aspects :\

Contents of this article \
1. Category The creation and nature of
1.1. Creation of classification variables
1.2. Structure of categorical variables
1.3. Category modification
2. Sorting of categorical variables
2.1. Establishment of order
2.2. Sort
3. Comparison of classified variables
3.1. Comparison with scalar or equal length sequences
3.2. Comparison with another categorical variable
4. Questions and exercises
4.1. problem
4.2. practice
First , Read in the data :\
import pandas as pd
import numpy as np
df = pd.read_csv('data/table.csv')
df.head()
One 、category The creation and nature of
pd.Series(["a", "b", "c", "a"], dtype="category")

temp_df = pd.DataFrame({'A':pd.Series(["a", "b", "c", "a"], dtype="category"),'B':list('abcd')})
temp_df.dtypes

cat = pd.Categorical(["a", "b", "c", "a"], categories=['a','b','c'])
pd.Series(cat)

pd.cut(np.random.randint(0,60,5), [0,10,30,60])

pd.cut(np.random.randint(0,60,5), [0,10,30,60], right=False, labels=['0-10','10-30','30-60'])

s = pd.Series(pd.Categorical(["a", "b", "c", "a",np.nan], categories=['a','b','c','d']))
s.describe()

s.cat.categories
Index(['a', 'b', 'c', 'd'], dtype='object')
s.cat.ordered
False
s = pd.Series(pd.Categorical(["a", "b", "c", "a",np.nan], categories=['a','b','c','d']))
s.cat.set_categories(['new_a','c'])

s = pd.Series(pd.Categorical(["a", "b", "c", "a",np.nan], categories=['a','b','c','d']))
s.cat.rename_categories(['new_%s'%i for i in s.cat.categories])

s.cat.rename_categories({'a':'new_a','b':'new_b'})

s = pd.Series(pd.Categorical(["a", "b", "c", "a",np.nan], categories=['a','b','c','d']))
s.cat.add_categories(['e'])

s = pd.Series(pd.Categorical(["a", "b", "c", "a",np.nan], categories=['a','b','c','d']))
s.cat.remove_categories(['d'])

s = pd.Series(pd.Categorical(["a", "b", "c", "a",np.nan], categories=['a','b','c','d']))
s.cat.remove_unused_categories()

s = pd.Series(["a", "d", "c", "a"]).astype('category').cat.as_ordered()
s

Degenerate into unordered variables , Just use as_unordered
s.cat.as_unordered()

pd.Series(["a", "d", "c", "a"]).astype('category').cat.set_categories(['a','c','d'],ordered=True)

s = pd.Series(["a", "d", "c", "a"]).astype('category')
s.cat.reorder_categories(['a','c','d'],ordered=True)

#s.cat.reorder_categories(['a','c'],ordered=True) # Report errors
#s.cat.reorder_categories(['a','c','d','e'],ordered=True) # Report errors
s = pd.Series(np.random.choice(['perfect','good','fair','bad','awful'],50)).astype('category')
s.cat.set_categories(['perfect','good','fair','bad','awful'][::-1],ordered=True).head()

s.sort_values(ascending=False).head()

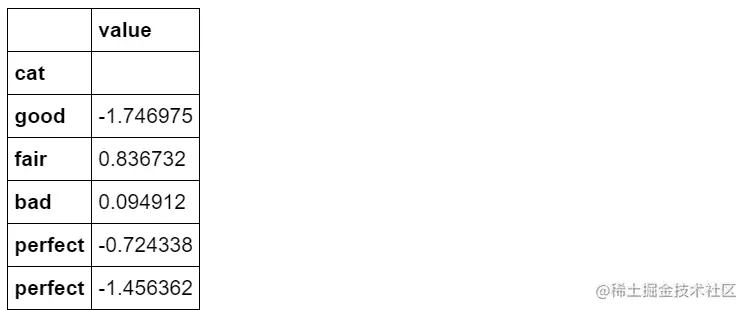
df_sort = pd.DataFrame({'cat':s.values,'value':np.random.randn(50)}).set_index('cat')
df_sort.head()

df_sort.sort_index().head()

3、 ... and 、 Comparison of classified variables
s = pd.Series(["a", "d", "c", "a"]).astype('category')
s == 'a'

s == list('abcd')

s = pd.Series(["a", "d", "c", "a"]).astype('category')
s == s

s != s

s_new = s.cat.set_categories(['a','d','e'])
#s == s_new # Report errors
s = pd.Series(["a", "d", "c", "a"]).astype('category')
#s >= s # Report errors
s = pd.Series(["a", "d", "c", "a"]).astype('category').cat.reorder_categories(['a','c','d'],ordered=True)
s >= s

4.1. problem
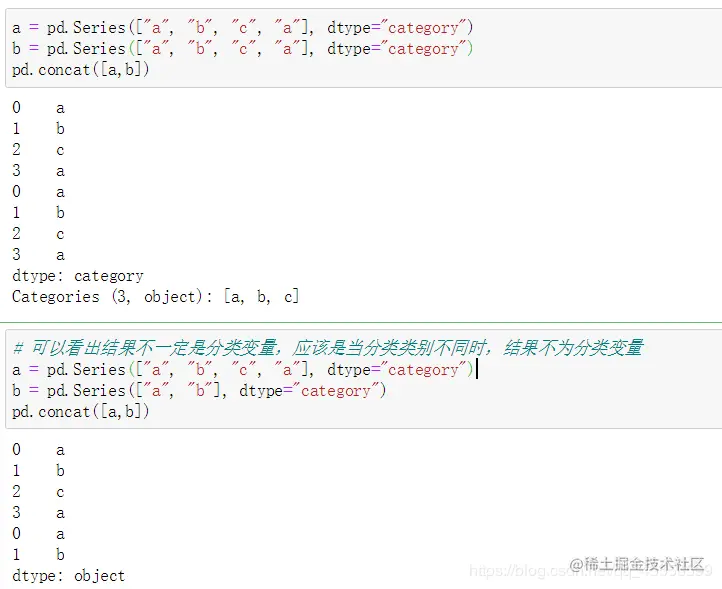
from pandas.api.types import union_categoricals
a = pd.Categorical(['b','c'])
b = pd.Categorical(['a','b'])
union_categoricals([a,b])


【 Question 3 】 When using groupby Methods or value_counts When the method is used , What is the difference between the statistical results of classified variables and ordinary variables ?\
cat = pd.Categorical([1, 2, 3, 10], categories=[1, 2, 3, 4, 10])
s = pd.Series(cat, name="cat")
cat

s.iloc[0:2] = 10
cat

4.2. practice
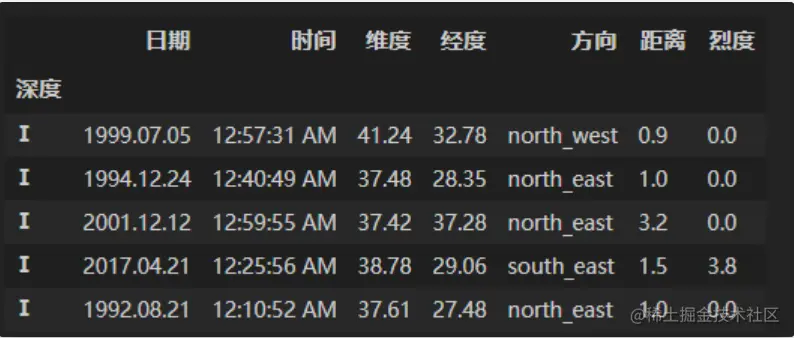
df = pd.read_csv('data/Earthquake.csv')
df_result = df.copy()
df_result[' depth '] = pd.cut(df[' depth '],[0,5,10,15,20,30,50,np.inf], right=False, labels=['Ⅰ','Ⅱ','Ⅲ','Ⅳ','Ⅴ','Ⅵ','Ⅶ'])
df_result = df_result.set_index(' depth ').sort_index()
df_result.head()

df[' earthquake intensity '] = pd.cut(df[' earthquake intensity '],[0,3,4,5,np.inf], right=False, labels=['Ⅰ','Ⅱ','Ⅲ','Ⅳ'])
df[' depth '] = pd.cut(df[' depth '],[0,5,10,15,20,30,50,np.inf], right=False, labels=['Ⅰ','Ⅱ','Ⅲ','Ⅳ','Ⅴ','Ⅵ','Ⅶ'])
df_ds = df.set_index([' depth ',' earthquake intensity '])
df_ds.sort_index()
【 Exercise 2 】 For categorical variables , Call No 4 The deformation function in the chapter will have a BUG( Not fixed in the current version ): For example, for crosstab function , According to the official documents , Even variables that do not appear will appear in the summary results after deformation , But it's not , For example, the following example lacks the lines that should have appeared 'c' And column 'f'. Based on this problem , Try designing my_crosstab function , It can return correct results in function .
foo = pd.Categorical(['b','a'], categories=['a', 'b', 'c'])
bar = pd.Categorical(['d', 'e'], categories=['d', 'e', 'f'])
import numpy
def my_crosstab(a, b):
s1 = pd.Series(list(foo.categories), name='row')
s2 = list(bar.categories)
df = pd.DataFrame(np.zeros((len(s1), len(s2)),int),index=s1, columns=s2)
index_1 = list(foo)
index_2 = list(bar)
for loc in zip(index_1, index_2):
df.loc[loc] = 1
return df
my_crosstab(foo, bar)
 An interesting interview question for a factory test, can you answer it with Python or Shell?
This article is a test develop
 Python advanced articles: Baidu index decryption [capture JS reverse data distinction]
前言大家好,我是辣條哥~過往給大家更新了不少基礎相關的,今天