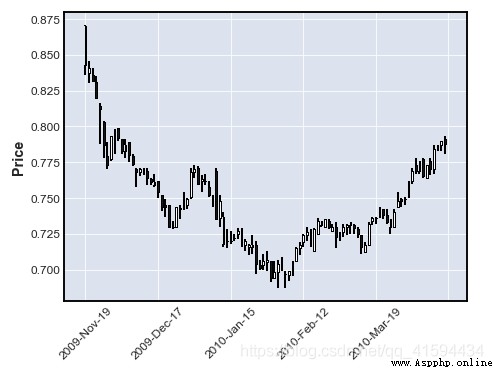
Images commonly used in quantitative investment systems
1. Use the bag mplfinance
import mplfinance as mpf
Installation method
pip install --upgrade mplfinance
2. Data processing
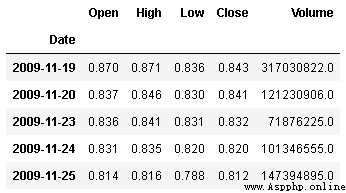
This method draws the image code is relatively simple , Strict data requirements
df =df.set_index(["Date"])
df.index = pd.DatetimeIndex(df.index)# Multiple indexes can be directly operated

3. drawing
mpf.plot(data.iloc[:100],type='candle')
