(https://github.com/MLEveryday/100-Days-Of-ML-Code.git)
說明:文章中的python代碼大部分來自於github(少數是學習時測試添加),所附筆記為學習時注。
數據預處理–>通過訓練集來訓練簡單線性回歸模型–>預測結果–>可視化
# Day2:Simple_Linear_Regression
# 2019.2.14
# coding=utf-8
# Data Preprocessing
# 1.引入所需要的庫
import pandas as pd
import numpy as np
import matplotlib.pyplot as plt
# 2.導入數據
dataset = pd.read_csv('C:/Users/Ymy/Desktop/100-Days-Of-ML-Code/datasets/studentscores.csv');
# X為導入dataset的第0列,Y為第1列
X = dataset.iloc[:,:1].values
Y = dataset.iloc[:,1].values
# 3.檢查缺失數據(由於此數據無缺失值,此步驟省略)
# 4.劃分數據集(測試集合占25%)
from sklearn.model_selection import train_test_split
X_train, X_test, Y_train, Y_test = train_test_split(X, Y, test_size = 1/4, random_state = 0)
# Fitting Simple Linear Regression Model to the training set
# 1.使用sklearn.linear_model的LinearRegression類
from sklearn.linear_model import LinearRegression
# 2.創建LinearRegression類的對象regressor,並使用fit()方法
''' fit方法: def fit(self, X, y, sample_weight=None): """ Fit linear model. Parameters(參數) ---------- X (訓練數據): array-like or sparse matrix, shape (n_samples, n_features) Training data y (目標值): array_like, shape (n_samples, n_targets) Target values. Will be cast to X's dtype if necessary sample_weight : numpy array of shape [n_samples] Individual weights for each sample .. versionadded:: 0.17 parameter *sample_weight* support to LinearRegression. Returns(返回值) ------- self : returns an instance of self. """ '''
regressor = LinearRegression()
regressor = regressor.fit(X_train, Y_train)
# Predecting the Result
# 使用上一步的方法,預測測試集的結果
''' predict方法: def predict(self, X): """ Predict using the linear model Parameters ---------- X : array_like or sparse matrix, shape (n_samples, n_features) Samples. Returns ------- C : array, shape (n_samples,) Returns predicted values. """ '''
Y_pred = regressor.predict(X_test)
# Visualising the Training results(可視化訓練集結果,18組數據)
# 1.繪制x,y的散點圖,點的顏色為黃色
# matplotlib.pyplot的scatter方法(具體細節見底部鏈接)
''' def scatter( x, y, s=None, c=None, marker=None, cmap=None, norm=None, vmin=None, vmax=None, alpha=None, linewidths=None, verts=None, edgecolors=None, *, data=None, **kwargs) """ Parameters ---------- x, y : array_like, shape (n, ) The data positions. s : scalar or array_like, shape (n, ), optional c : color, sequence, or sequence of color, optional """ '''
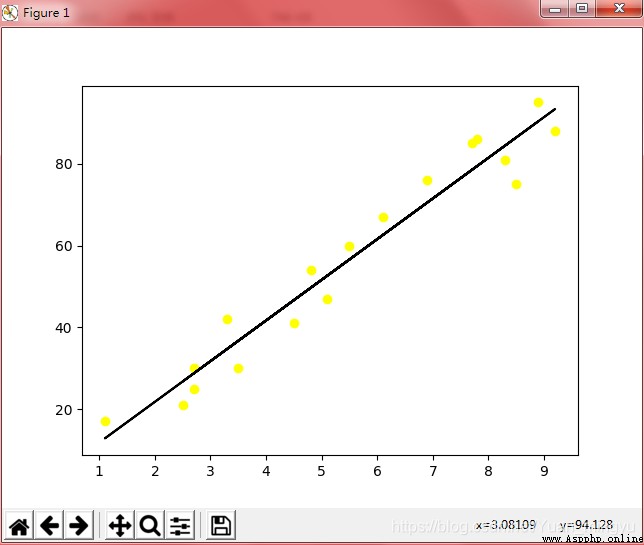
plt.scatter(X_train , Y_train, color = 'yellow')
# 2.繪制訓練集X與根據訓練集方法所預測的'Y',顏色為黑色
# matplotlib.pyplot的plot方法(具體細節見底部鏈接)
plt.plot(X_train , regressor.predict(X_train), color ='black')
# 3.顯示(此處如果顯示,圖中包含18個散點)
#plt.show()
# Visualizing the test results(可視化測試集結果)
#操作同上
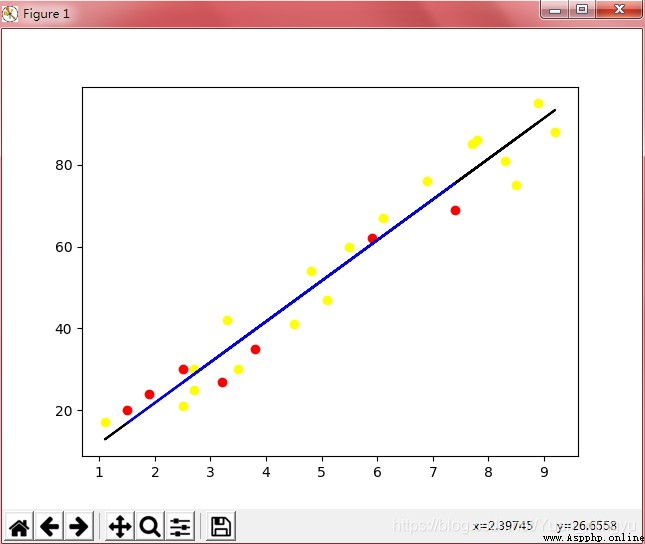
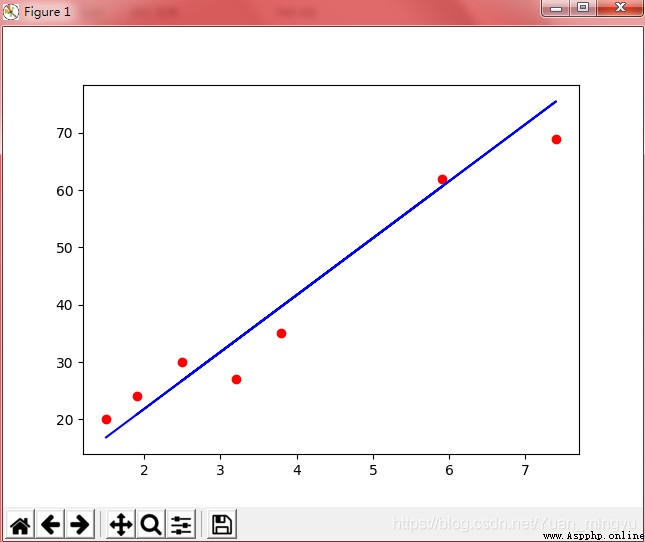
plt.scatter(X_test , Y_test, color = 'red')
plt.plot(X_test , regressor.predict(X_test), color ='blue')
#此處顯示,圖中包含25個點,即全部數據
plt.show()
p1:
p2(train):
p3(test):
注:按照學習部分的代碼,運行輸出結果為p1;根據p1可以看出,圖中包含兩組數據,為train和test兩組數據集所繪制圖像的疊加,而p2和p3就分別對應為train和test兩組數據集單獨繪制的圖像。
資料參考:
sklearn.linear_model.LinearRegression:
https://scikit-learn.org/stable/modules/generated/sklearn.linear_model.LinearRegression.html
matplotlib.pyplot.scatter:
https://matplotlib.org/api/_as_gen/matplotlib.pyplot.scatter.html
matplotlib.pyplot.plot:
https://matplotlib.org/api/_as_gen/matplotlib.pyplot.plot.html#matplotlib-pyplot-plot
 [Python automated test 24] interface Automated Test Practice IV_ Python operation database
List of articles One 、 Prefac
 Use Python penetration to achieve sandbox escape and see how hackers bypass the protection of the website?
讓用戶提交 Python 代碼並在服務器上執行,是一些 OJ