In explanation NII(NIFTI,neuroimaging information technology initiative) Before the format , We need to know first Analyze Format .
every last Analyze The format data contains two files : With binary image information .img, Header file containing image metadata .hdr
however ,Analyze The header file of does not really reflect metadata ( For example, there is no direction information ,eg On the left or on the right ), therefore NIFTI Format file came into being
nii Format (nifti Format extension ) It was invented for multidimensional neuroimaging . One nii The format mainly consists of three parts :hdr, ext, img
There are two formats for medical image data ,dicom and nii Format , They define different directions 
Be careful : When using this software , No Chinese in the path
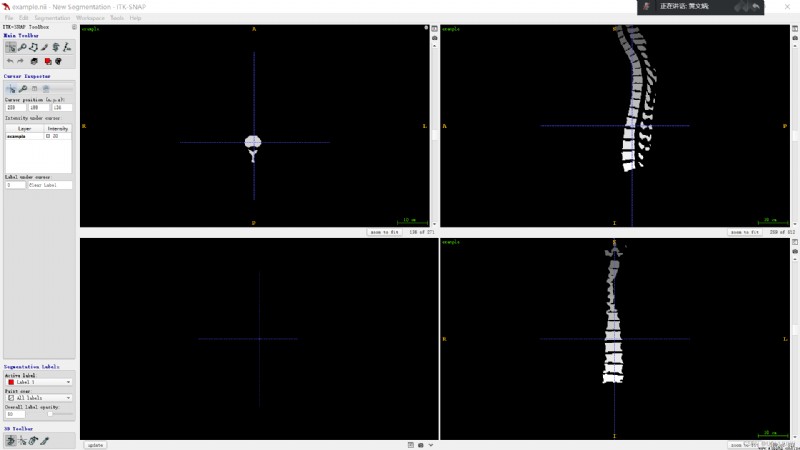
Three views

import nibabel as nib
filename = 'CTC-1835078273_seg.nii'
img = nib.load(filename)
img.shape
#(512, 512, 539)
One nibable The image is composed of three parts :
data = img.get_fdata()
data.shape,type(data)
#((512, 512, 539), numpy.memmap)At least some image data And a image Coordinate transformation matrix (affine)
import numpy as np
data = np.random.randint((32, 32, 15, 100), dtype=np.int16)
img = nib.Nifti1Image(data, np.eye(4))
nib.save(img, 'exa.nii') 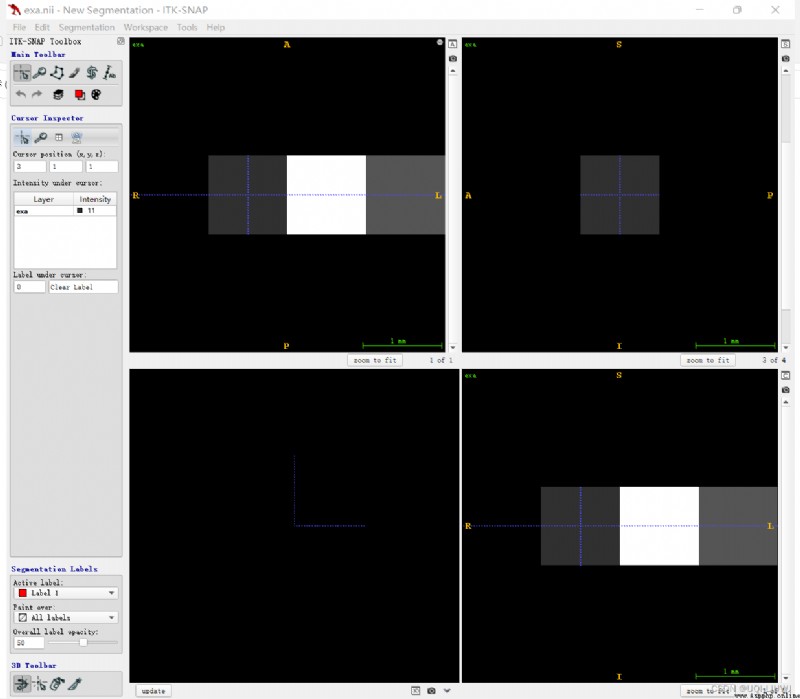
here numpy.memmap Is a memory image file . It is a way to treat very large binary data files on disk as arrays in memory . It allows the Divide large files into small sections for reading and writing , Instead of reading the entire array into memory at once .
memmap It also has the same method as an ordinary array , therefore , Basically as long as it can be used for ndarray Our algorithm can also be used for memmap.
In the official documentation , Provides a human brain MRI Images .
import nibabel as nib
epi_img = nib.load('someones_epi.nii.gz')
epi_img_data = epi_img.get_fdata()
epi_img_data.shape
#(53, 61, 33)
[EPI data ] Let's look at the first dimension of an array 、 Slices on the second and third dimensions .
import matplotlib.pyplot as plt
def show_slices(slices):
""" Function to display row of image slices """
fig, axes = plt.subplots(1, len(slices))
for i, slice in enumerate(slices):
axes[i].imshow(slice.T, cmap="gray", origin="lower")
slice_0 = epi_img_data[0, :, :]
slice_1 = epi_img_data[:, 0, :]
slice_2 = epi_img_data[:, :, 0]
show_slices([slice_0, slice_1, slice_2])
plt.suptitle("Center slices for EPI image")
image Dimension is (53, 61, 33), Think of it as 53 Zhang 61*33 Graph , Think of it as 61 Zhang 53*33 Graph , It can also be thought of as 33 Zhang 53*61 Graph
[ Structural data ( The anatomy of the )]
anat_img = nib.load('someones_anatomy.nii.gz')
anat_img_data = anat_img.get_fdata()
print(anat_img_data.shape)
#(57, 67, 56)
show_slices([anat_img_data[0, :, :],
anat_img_data[:, 0, :],
anat_img_data[:, :, 0]])
plt.suptitle("Center slices for anatomical image")
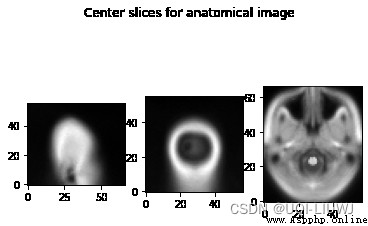
Usually , We have different anatomical scanning fields , So anatomical images have different shapes 、 Size and direction .
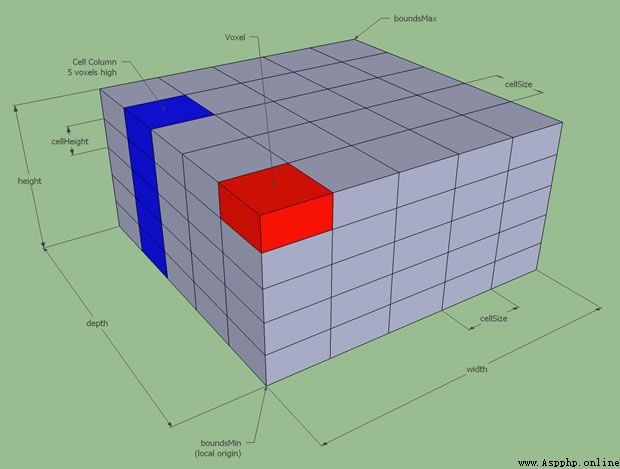
Voxels are pixels with volume .
In the code above , come from EPI Data slice_0 Is from 3D Graphic 2D section . Each pixel in the slice gray image also represents a voxel , Because of this 2D The image represents 3D A slice with a certain thickness in an image .
therefore ,3D Arrays are also voxel arrays . For any array , We can all select a specific value through the index . for example , We can get... Like this EPI The value of the intermediate element in the data array :
epi_img_data[0,0,0]
#10.755071640014648
[0,0,0] Voxel coordinates
Voxel coordinates hardly tell us where the data comes from in the scanner . for example , Suppose we have voxel coordinates (26, 30, 16). If there is no more information , We don't know whether this voxel is on the left or right side of the brain , Or from the left or right side of the scanner . This is because the scanner allows us to collect voxel data in almost any position and direction .
So let's say we're talking about EPI chart , Rotate the scanner a little , Get the part in the red box
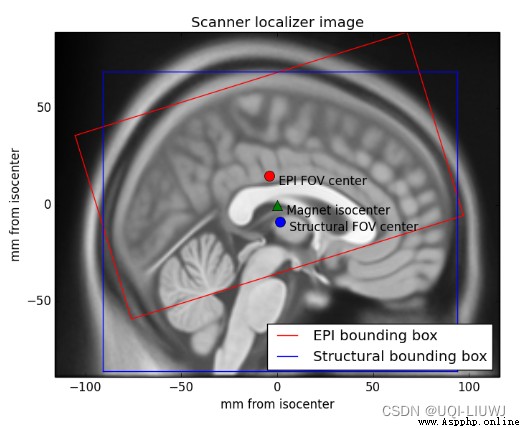
We dissected and EPI scanning , Later, we certainly hope to be able to somes_epi.nii.gz Data in and someones_anatomy.nii.gz Related to . At present, we can not do this easily , Because the anatomical images we collected are similar to EPI Images have different views and directions . Therefore, the voxel coordinates cannot correspond to each other for the time being .
We solve this problem by tracking the relationship between voxel coordinates and some reference spaces . To be specific , Affine array (affine) Storage The relationship between the voxel coordinates in the image data and the coordinates in the reference space
“ Reference space ” Medium “ Space ” What does that mean? ? The space is defined by an ordered set of axes . For our 3D Space world , It's a group 3 Two independent axes . We can determine the space we want to use by selecting these axes . We need to select the origin of the axis 、 Direction and units .(xyz- Axis , In millimeters )
We want to put the voxel coordinates (i,j,k) Convert to reference space coordinates (x,y,z), namely (x,y,z)=f(i,j,k)
And basic matrix multiplication , You can meet
Axis expansion rotate
 Rotate around the first axis

Rotate around the second axis

Rotate around the third axis

These basic operations are combined ( Matrix multiplication ), The transformation of coordinate axis can be realized
The above completes the correspondence of coordinate axes , But the origin of voxels (0,0,0) The corresponding is not necessarily the reference space (0,0,0) spot , Suppose the corresponding is in the reference space (a,b,c) coordinate , that , In voxels (i,j,k) The corresponding is in the reference space (x,y,z) 

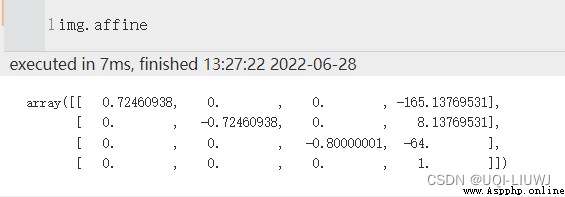
reference
NII - Just Solve the File Format Problem (archiveteam.org)
How to read NIFTI format image (. nii file) (programmer.group)
What is voxel (Voxel)? - You know (zhihu.com)