簡介
安裝
使用方法
1、通過裝飾器運行
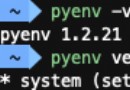
2、通過命令行運行
補充
簡介memory_profiler是第三方模塊,用於監視進程的內存消耗以及python程序內存消耗的逐行分析。它是一個純python模塊,依賴於psutil模塊。
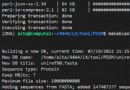
安裝pip install memory_profiler使用方法1、通過裝飾器運行@profiledef func1():2、通過命令行運行python -m memory_profiler test_code.py案例源碼:
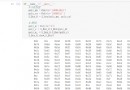
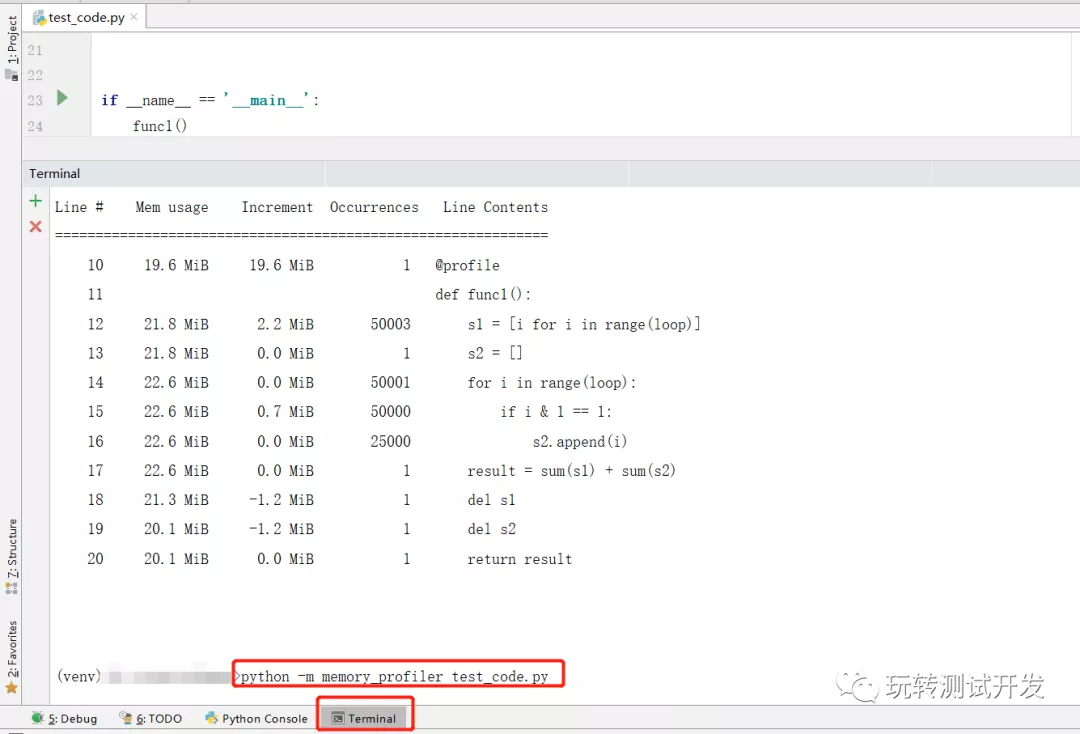
# -*- coding: utf-8 -*-# time: 2022/6/11 21:17# file: test_code.py# 公眾號: 玩轉測試開發from memory_profiler import profileloop = [email protected] func1(): s1 = [i for i in range(loop)] s2 = [] for i in range(loop): if i & 1 == 1: s2.append(i) result = sum(s1) + sum(s2) del s1 del s2 return resultif __name__ == '__main__': result = func1() print(result)方法1運行結果:
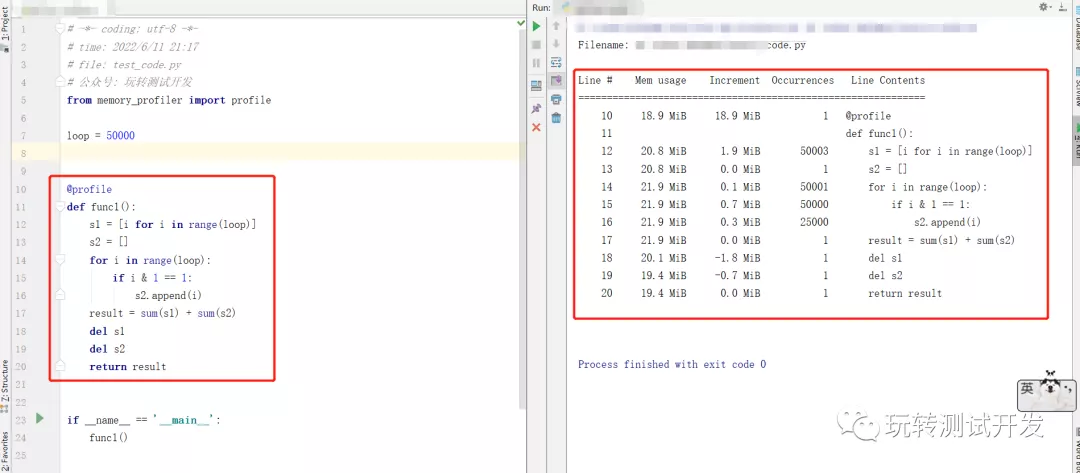
方法2運行結果:
下面小編為大家整理了一下memory_profiler的一些使用
1、直接打印結果到終端上
#coding:utf8 from memory_profiler import profile @profile def test1(): c=list() for item in range(10000): c.append(item) if __name__=='__main__': test1() 結果如下
Filename: D:/python/test_sip/test_check_es.py
Line # Mem usage Increment Line Contents
================================================
474 16.6 MiB 16.6 MiB @profile
475 def test1():
476 16.6 MiB 0.0 MiB c=list()
477 17.0 MiB 0.0 MiB for item in range(10000):
478 17.0 MiB 0.1 MiB c.append(item)
2、定義輸出到文件,定義結果保留的小數位
#coding:utf8 from memory_profiler import profile @profile(precision=4,stream=open('memory_profiler.log','w+')) def test1(): c=list() for item in range(10000): c.append(item) if __name__=='__main__': test1() 結果如下
Filename: D:/python/test_sip/test_check_es.py
Line # Mem usage Increment Line Contents
================================================
474 16.5391 MiB 16.5391 MiB @profile(precision=4,stream=open('memory_profiler.log','w+'))
475 def test1():
476 16.5430 MiB 0.0039 MiB c=list()
477 16.8906 MiB 0.0039 MiB for item in range(10000):
478 16.8906 MiB 0.0391 MiB c.append(item)
到此這篇關於Python利用memory_profiler查看內存占用情況的文章就介紹到這了,更多相關Python memory_profiler查看內存占用內容請搜索軟件開發網以前的文章或繼續浏覽下面的相關文章希望大家以後多多支持軟件開發網!