brief introduction
install
Usage method
1、 Run through finisher
2、 Run... From the command line
Add
brief introductionmemory_profiler Is a third-party module , Used to monitor the memory consumption of the process and python Line by line analysis of program memory consumption . It's a pure python modular , Depend on psutil modular .
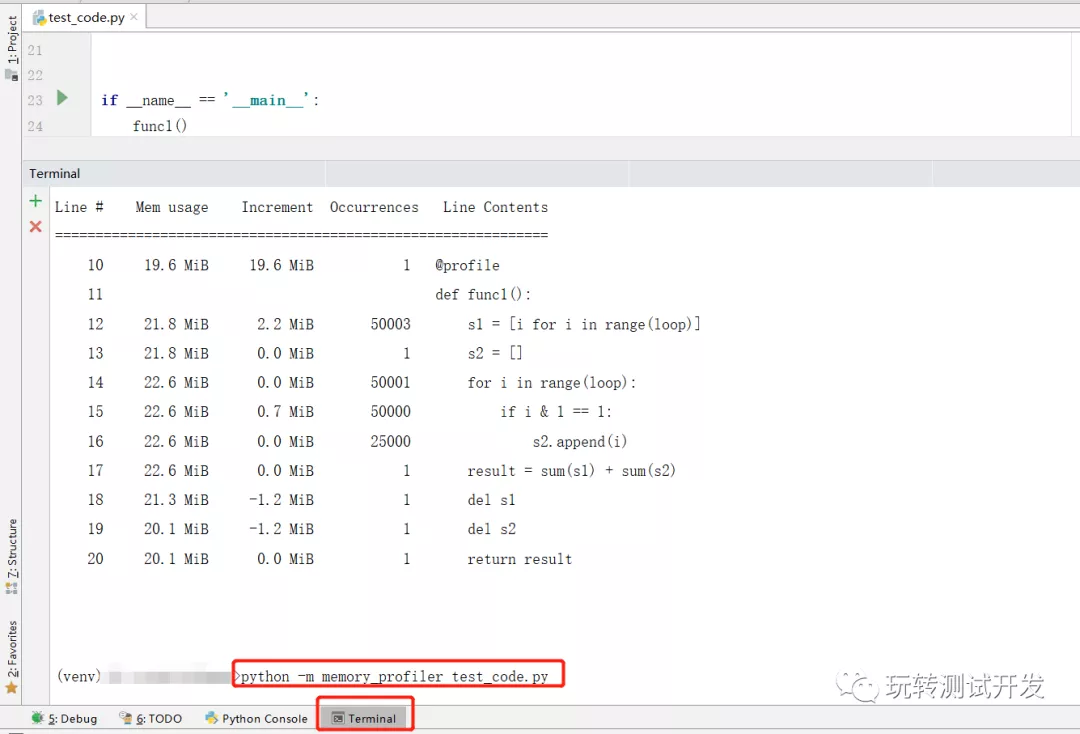
installpip install memory_profiler Usage method 1、 Run through finisher @profiledef func1():2、 Run... From the command line python -m memory_profiler test_code.pySource code of case :
# -*- coding: utf-8 -*-# time: 2022/6/11 21:17# file: test_code.py# official account : Play with test development from memory_profiler import profileloop = [email protected] func1(): s1 = [i for i in range(loop)] s2 = [] for i in range(loop): if i & 1 == 1: s2.append(i) result = sum(s1) + sum(s2) del s1 del s2 return resultif __name__ == '__main__': result = func1() print(result)Method 1 Running results :
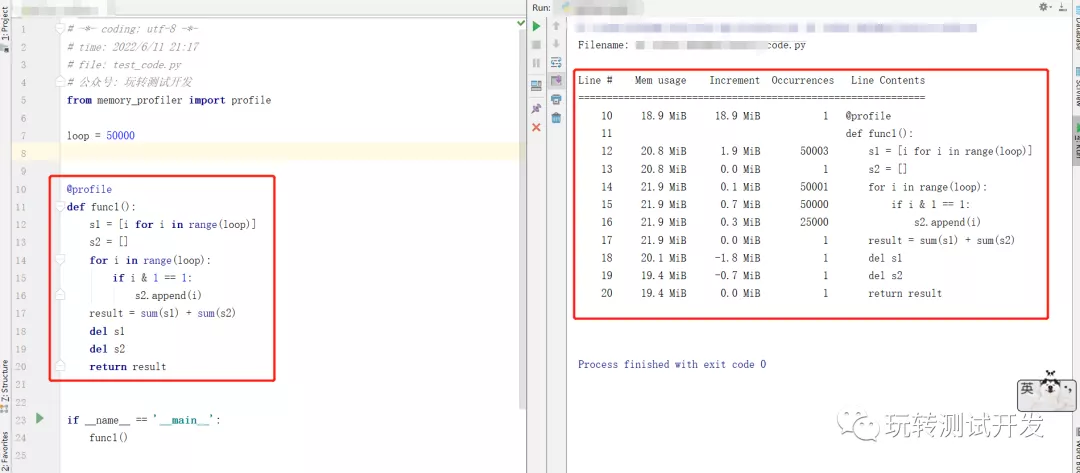
Method 2 Running results :
The following is a compilation for you memory_profiler Some uses of
1、 Print results directly to the terminal
#coding:utf8 from memory_profiler import profile @profile def test1(): c=list() for item in range(10000): c.append(item) if __name__=='__main__': test1() give the result as follows
Filename: D:/python/test_sip/test_check_es.py
Line # Mem usage Increment Line Contents
================================================
474 16.6 MiB 16.6 MiB @profile
475 def test1():
476 16.6 MiB 0.0 MiB c=list()
477 17.0 MiB 0.0 MiB for item in range(10000):
478 17.0 MiB 0.1 MiB c.append(item)
2、 Define output to file , Define the decimal places reserved for the results
#coding:utf8 from memory_profiler import profile @profile(precision=4,stream=open('memory_profiler.log','w+')) def test1(): c=list() for item in range(10000): c.append(item) if __name__=='__main__': test1() give the result as follows
Filename: D:/python/test_sip/test_check_es.py
Line # Mem usage Increment Line Contents
================================================
474 16.5391 MiB 16.5391 MiB @profile(precision=4,stream=open('memory_profiler.log','w+'))
475 def test1():
476 16.5430 MiB 0.0039 MiB c=list()
477 16.8906 MiB 0.0039 MiB for item in range(10000):
478 16.8906 MiB 0.0391 MiB c.append(item)
This is about Python utilize memory_profiler This is the end of the article on checking memory usage , More about Python memory_profiler To view the content of memory occupation, please search the previous articles of software development network or continue to browse the relevant articles below. I hope you can support software development network more in the future !