Segment the commodity amount of the original data , Count the number of orders in each section
Use by box pd.cut()
pd.cut(x,bins,right=True,labels=None,retbins=False,precision=3,include_lowest=False,duplicates='raise')
x : One dimensional array
bins : Integers , Scalar sequence or interval index , It is the basis for grouping ,
If you fill in an integer n, Will be x The values in are divided into equal width n Share ( That is, the difference between the maximum value and the minimum value in each group is approximately equal );
If it's a scalar sequence , The values in the sequence represent the dividing values used for grading
If it is an interval index ,“ bins” The interval indexes of must not overlap
right : Boolean value , The default is True Indicates that it contains the rightmost value
When “ right = True”( The default value is ) when , be “ bins”=[1、2、3、4] Express (1,2],(2,3],(3,4]
When bins Is an interval index , This parameter is ignored .
labels : Array or Boolean , Optional . Specify the label of the sub box
If it's an array , The length should be consistent with the number of boxes , such as “ bins”=[1、2、3、4] Express (1,2],(2,3],(3,4] altogether 3 Intervals , be labels The length of the tag is the number of tags 3
If False, Then only the integer indicator of the bin is returned , namely x The data in is in the first few boxes
When bins Is the interval index , This parameter will be ignored
retbins: Whether to display the boundary value of sub box . The default is False, When bins When taking an integer, you can set retbins=True To display the boundary value , Get the divided interval
precision: Integers , Default 3, Accuracy of storing and displaying sub box labels .
include_lowest: Boolean value , Indicates whether the left side of the interval is open or closed , The default is false, That is, the left side of the interval is not included .
duplicates: If the critical value of container separation is not unique , The cause ValueError Or discard non unique
Visual Statistics , Use pd.pivot_table()
df = pd.read_excel(' newly build XLSX Worksheet .xlsx',sheet_name= 'Sheet1') # Read data entry Python Program
data = df[[' The order number ',' Time of payment ',' Order amount ',' Name of commodity ',' Product specifications ',' The number ',' The amount of goods ']] # Select the data column you want to use
print(data.head()) # Print data 
# Define the amount range
je_cut =[0,10,50,100,150,200,500,100000]
je_label = ['0-10','10-50','50-100','100-150','150-200','200-500','500 above '] # Label the amount range
data[' Amount range '] = pd.cut(data[' The amount of goods '],bins=je_cut,labels= je_label)
print(data)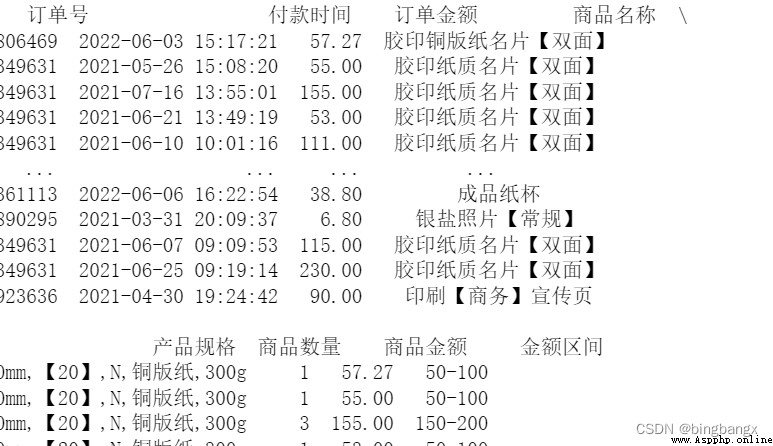
Data = pd.pivot_table(data,values = [' The order number '],index = [' Amount range '],aggfunc = {' The order number ':lambda x: len(x.dropna().unique())}
,fill_value =0).reset_index(drop = False) # fill_value = 0 Is used to fill in missing values 、 Null value
Data = Data.rename(columns ={' The order number ':' Number of orders '}) # Change column names
print(Data)
thus , We have completed the statistical requirements of data by box ~~~~~~