In order to better master pandas Application in actual data analysis , Today, let's talk about how to use pandas Analyze the data of American restaurants .
The source of the data is UCI ML Repository, Contains more than 1000 pieces of data , Yes 5 Attributes , Namely :
userID: user ID
placeID: The restaurant ID
rating: Overall rating
food_rating: Food score
service_rating: Service rating
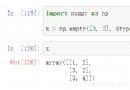
We use pandas To read data :
import numpy as np
path = '../data/restaurant_rating_final.csv'
df = pd.read_csv(path)
df
1161 rows × 5 columns
If we focus on the total score and food score of different restaurants , Let's look at the average score of these restaurants first , Here we use pivot_table Method :
mean_ratings = df.pivot_table(values=['rating','food_rating'], index='placeID',
aggfunc='mean')
mean_ratings[:5]
Then look at each placeID, Statistics on the number of voters :
ratings_by_place = df.groupby('placeID').size()
ratings_by_place[:10]
placeID
132560 4
132561 4
132564 4
132572 15
132583 4
132584 6
132594 5
132608 6
132609 5
132613 6
dtype: int64
If the turnout is too small , So these data are actually not objective , Let's pick a number of people who voted more than 4 A restaurant :
active_place = ratings_by_place.index[ratings_by_place >= 4]
active_place
Int64Index([132560, 132561, 132564, 132572, 132583, 132584, 132594, 132608,
132609, 132613,
...
135080, 135081, 135082, 135085, 135086, 135088, 135104, 135106,
135108, 135109],
dtype='int64', name='placeID', length=124)
Choose the average rating data of these restaurants :
mean_ratings = mean_ratings.loc[active_place]
mean_ratings
124 rows × 2 columns
Yes rating Sort , Choose the one with the highest score 10 individual :
top_ratings = mean_ratings.sort_values(by='rating', ascending=False)
top_ratings[:10]
We can also calculate the difference between the average total score and the average food score , And with a column diff Preservation :
mean_ratings['diff'] = mean_ratings['rating'] - mean_ratings['food_rating']
sorted_by_diff = mean_ratings.sort_values(by='diff')
sorted_by_diff[:10]
Invert the data , Choose the front with the largest gap 10:
sorted_by_diff[::-1][:10]
Calculation rating Standard deviation , And choose the largest front 10 individual :
# Standard deviation of rating grouped by placeID
rating_std_by_place = df.groupby('placeID')['rating'].std()
# Filter down to active_titles
rating_std_by_place = rating_std_by_place.loc[active_place]
# Order Series by value in descending order
rating_std_by_place.sort_values(ascending=False)[:10]
placeID
134987 1.154701
135049 1.000000
134983 1.000000
135053 0.991031
135027 0.991031
132847 0.983192
132767 0.983192
132884 0.983192
135082 0.971825
132706 0.957427
Name: rating, dtype: float64
This article has been included in http://www.flydean.com/02-pandas-restaurant/
The most popular interpretation , The deepest dry goods , The most concise tutorial , There are so many tricks you don't know about waiting for you to discover !
Welcome to my official account. :「 Program those things 」, Know technology , Know you better !