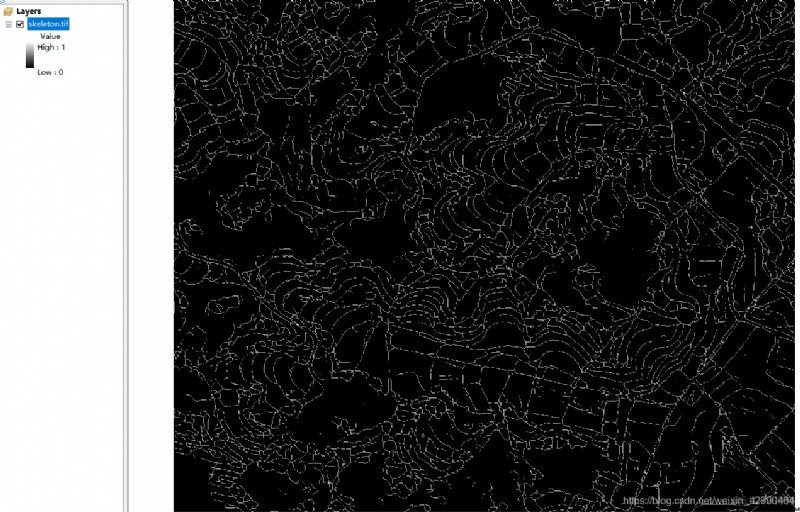
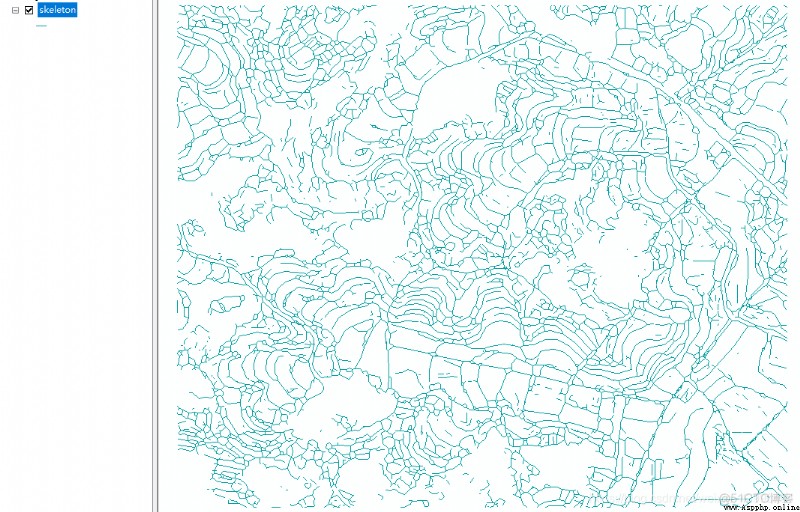
本博文將介紹如何將柵格線轉化成矢量線的方法。大致流程可分為,柵格線轉圖結構表示,再由圖結構的點關系,寫入進線矢量。

image2graph.py
# import rdp


# Code Copied From Favyen


import
scipy.
ndimage


import
skimage.
morphology


import
os


from
PIL
import
Image


import
cv2


import
math


import
numpy


from
math
import
sqrt


import
pickle


import
gdalTools


def
distance(
a,
b):


return
sqrt((
a[
0]
-
b[
0])
*
*
2
+ (
a[
1]
-
b[
1])
*
*
2)


def
point_line_distance(
point,
start,
end):


if (
start
==
end):


return
distance(
point,
start)


else:


n
=
abs(

 (
end[
0]
-
start[
0])
* (
start[
1]
-
point[
1])
- (
start[
0]
-
point[
0])
* (
end[
1]
-
start[
1])

 )


d
=
sqrt(

 (
end[
0]
-
start[
0])
*
*
2
+ (
end[
1]
-
start[
1])
*
*
2

 )


return
n
/
d


def
rdp(
points,
epsilon):


"""


 Reduces a series of points to a simplified version that loses detail, but


 maintains the general shape of the series.


 """


dmax
=
0.0


index
=
0


for
i
in
range(
1,
len(
points)
-
1):


d
=
point_line_distance(
points[
i],
points[
0],
points[
-
1])


if
d
>
dmax:


index
=
i


dmax
=
d


if
dmax
>=
epsilon:


results
=
rdp(
points[:
index
+
1],
epsilon)[:
-
1]
+
rdp(
points[
index:],
epsilon)


else:


results
= [
points[
0],
points[
-
1]]


return
results


def
generateGraph(
in_fname):


PADDING
=
30


threshold
=
1


out_fname
=
'graph_gt.pickle'


im_proj,
im_geotrans,
im_width,
im_height,
im_data
=
gdalTools.
read_img(
in_fname)


im
=
im_data


im
=
numpy.
array(
im)


if
len(
im.
shape)
==
3:


print(
'warning: bad shape {}, using first channel only'.
format(
im.
shape))


im
=
im[:, :,
0]


im
=
numpy.
swapaxes(
im,
0,
1)


im
= (
im
>=
threshold)


Image.
fromarray(
im.
astype(
'uint8')
*
60).
save(
"tmp0.png")


im
=
skimage.
morphology.
thin(
im)


im
=
im.
astype(
'uint8')


Image.
fromarray(
im
*
255).
save(
"tmp.png")


# extract a graph by placing vertices every THRESHOLD pixels, and at all intersections


vertices
= []


edges
=
set()


def
add_edge(
src,
dst):


if (
src,
dst)
in
edges
or (
dst,
src)
in
edges:


return


elif
src
==
dst:


return


edges.
add((
src,
dst))


point_to_neighbors
= {}


q
= []


while
True:


if
len(
q)
>
0:


lastid,
i,
j
=
q.
pop()


path
= [
vertices[
lastid], (
i,
j)]


if
im[
i,
j]
==
0:


continue


point_to_neighbors[(
i,
j)].
remove(
lastid)


if
len(
point_to_neighbors[(
i,
j)])
==
0:


del
point_to_neighbors[(
i,
j)]


else:


w
=
numpy.
where(
im
>
0)


if
len(
w[
0])
==
0:


break


i,
j
=
w[
0][
0],
w[
1][
0]


lastid
=
len(
vertices)


vertices.
append((
i,
j))


path
= [(
i,
j)]


while
True:


im[
i,
j]
=
0


neighbors
= []


for
oi
in [
-
1,
0,
1]:


for
oj
in [
-
1,
0,
1]:


ni
=
i
+
oi


nj
=
j
+
oj


if
ni
>=
0
and
ni
<
im.
shape[
0]
and
nj
>=
0
and
nj
<
im.
shape[
1]
and
im[
ni,
nj]
>
0:


neighbors.
append((
ni,
nj))


if
len(
neighbors)
==
1
and (
i,
j)
not
in
point_to_neighbors:


ni,
nj
=
neighbors[
0]


path.
append((
ni,
nj))


i,
j
=
ni,
nj


else:


if
len(
path)
>
1:


path
=
rdp(
path,
2)


if
len(
path)
>
2:


for
point
in
path[
1:
-
1]:


curid
=
len(
vertices)


vertices.
append(
point)


add_edge(
lastid,
curid)


lastid
=
curid


neighbor_count
=
len(
neighbors)
+
len(
point_to_neighbors.
get((
i,
j), []))


if
neighbor_count
==
0
or
neighbor_count
>=
2:


curid
=
len(
vertices)


vertices.
append(
path[
-
1])


add_edge(
lastid,
curid)


lastid
=
curid


for
ni,
nj
in
neighbors:


if (
ni,
nj)
not
in
point_to_neighbors:


point_to_neighbors[(
ni,
nj)]
=
set()


point_to_neighbors[(
ni,
nj)].
add(
lastid)


q.
append((
lastid,
ni,
nj))


for
neighborid
in
point_to_neighbors.
get((
i,
j), []):


add_edge(
neighborid,
lastid)


break


neighbors
= {}


# print(vertices)


# with open(out_fname, 'w') as f:


# for vertex in vertices:


# f.write('{} {}\n'.format(vertex[0], vertex[1]))


# f.write('\n')


vertex
=
vertices


for
edge
in
edges:


nk1
= (
vertex[
edge[
0]][
1],
vertex[
edge[
0]][
0])


nk2
= (
vertex[
edge[
1]][
1],
vertex[
edge[
1]][
0])


if
nk1
!=
nk2:


if
nk1
in
neighbors:


if
nk2
in
neighbors[
nk1]:


pass


else:


neighbors[
nk1].
append(
nk2)


else:


neighbors[
nk1]
= [
nk2]


if
nk2
in
neighbors:


if
nk1
in
neighbors[
nk2]:


pass


else:


neighbors[
nk2].
append(
nk1)


else:


neighbors[
nk2]
= [
nk1]


# f.write('{} {}\n'.format(edge[0], edge[1]))


# f.write('{} {}\n'.format(edge[1], edge[0]))


# print(neighbors)


# pickle.dump(neighbors, open(out_fname, "wb"))


return
neighbors
raster2lineShp.py
import
gdalTools


import
numpy
as
np


from
skimage
import
morphology


import
cv2
as
cv


from
osgeo
import
gdalconst,
gdal,
ogr,
osr


import
os


from
image2graph
import
*


def
imagexy2geo(
dataset,
col,
row):


'''


 根據GDAL的六參數模型將影像圖上坐標(行列號)轉為投影坐標或地理坐標(根據具體數據的坐標系統轉換)


 :param dataset: GDAL地理數據


 :param row: 像素的行號


 :param col: 像素的列號


 :return: 行列號(row, col)對應的投影坐標或地理坐標(x, y)


 '''


trans
=
dataset.
GetGeoTransform()


px
=
trans[
0]
+
col
*
trans[
1]
+
row
*
trans[
2]


py
=
trans[
3]
+
col
*
trans[
4]
+
row
*
trans[
5]


return
px,
py


def
raster2LineShp(
img_path,
strVectorFile):


graph
=
generateGraph(
img_path)


dataset
=
gdal.
Open(
img_path)


gdal.
SetConfigOption(
"GDAL_FILENAME_IS_UTF8",
"NO")
# 為了支持中文路徑


gdal.
SetConfigOption(
"SHAPE_ENCODING",
"CP936")
# 為了使屬性表字段支持中文


ogr.
RegisterAll()


strDriverName
=
"ESRI Shapefile"
# 創建數據,這裡創建ESRI的shp文件


oDriver
=
ogr.
GetDriverByName(
strDriverName)


if
oDriver
==
None:


print(
"%s 驅動不可用!\n",
strDriverName)


oDS
=
oDriver.
CreateDataSource(
strVectorFile)
# 創建數據源


if
oDS
==
None:


print(
"創建文件【%s】失敗!",
strVectorFile)


# srs = osr.SpatialReference() # 創建空間參考


# srs.ImportFromEPSG(4326) # 定義地理坐標系WGS1984


srs
=
osr.
SpatialReference(


wkt
=
dataset.
GetProjection())
# 我在讀柵格圖的時候增加了輸出dataset,這裡就可以不用指定投影,實現全自動了,上面兩行可以注釋了,並且那個proj參數也可以去掉了,你們自己去掉吧


papszLCO
= []


# 創建圖層,創建一個多邊形圖層,"TestPolygon"->屬性表名


oLayer
=
oDS.
CreateLayer(
"TestPolygon",
srs,
ogr.
wkbMultiLineString,
papszLCO)


if
oLayer
==
None:


print(
"圖層創建失敗!\n")


oDefn
=
oLayer.
GetLayerDefn()
# 定義要素


oFeatureTriangle
=
ogr.
Feature(
oDefn)


# 創建單個面


for
n,
v
in
graph.
items():


# if cls > len(cls_dict) - 1:


# continue


for
nei
in
v:


line
=
ogr.
Geometry(
ogr.
wkbLinearRing)
# 構建幾何類型:線


nx,
ny
=
n[
1],
n[
0]


nx,
ny
=
imagexy2geo(
dataset,
nx,
ny)


line.
AddPoint(
nx,
ny)
# 添加點01


neix,
neiy
=
nei[
1],
nei[
0]


neix,
neiy
=
imagexy2geo(
dataset,
neix,
neiy)


line.
AddPoint(
neix,
neiy)
# 添加點02


# yard = ogr.Geometry(ogr.wkbLineString) # 構建幾何類型:多邊形


# yard.AddGeometry(line)


# yard.CloseRings()


# geomTriangle = ogr.CreateGeometryFromWkt(str(line)) # 將封閉後的多邊形集添加到屬性表


oFeatureTriangle.
SetGeometry(
line)


oLayer.
CreateFeature(
oFeatureTriangle)


oDS.
Destroy()


if
__name__
==
'__main__':


rasterPath
=
'./temp/skeleton.tif'


shpPath
=
'./temp/skeleton.shp'


raster2LineShp(
rasterPath,
shpPath)
