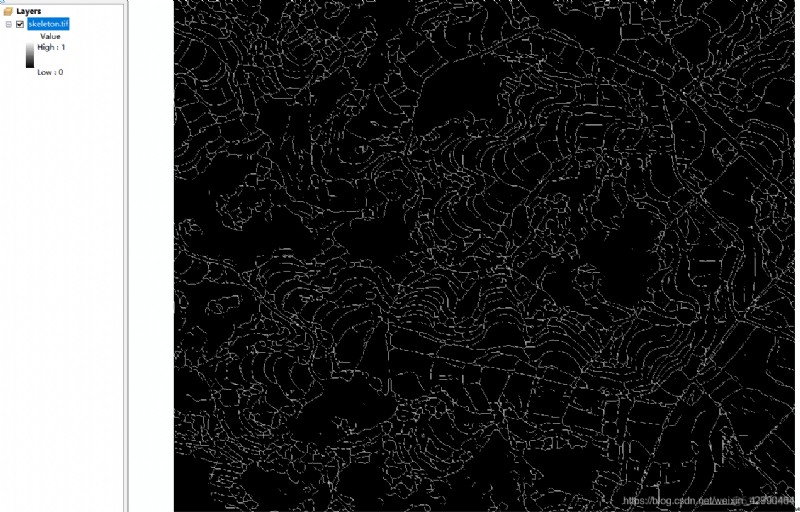
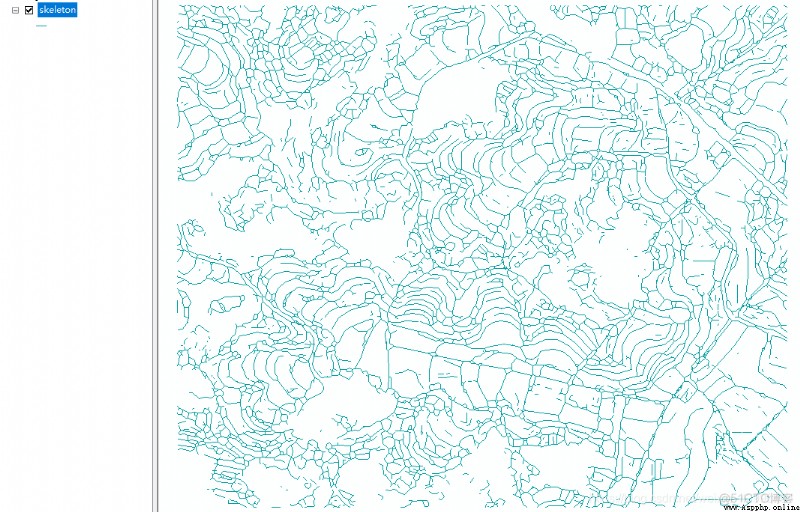
This blog will introduce how to convert grid lines into vector lines . The general process can be divided into , Grid line to graph structure representation , From the point relation of graph structure , Write in line vector .

image2graph.py
# import rdp


# Code Copied From Favyen


import
scipy.
ndimage


import
skimage.
morphology


import
os


from
PIL
import
Image


import
cv2


import
math


import
numpy


from
math
import
sqrt


import
pickle


import
gdalTools


def
distance(
a,
b):


return
sqrt((
a[
0]
-
b[
0])
*
*
2
+ (
a[
1]
-
b[
1])
*
*
2)


def
point_line_distance(
point,
start,
end):


if (
start
==
end):


return
distance(
point,
start)


else:


n
=
abs(

 (
end[
0]
-
start[
0])
* (
start[
1]
-
point[
1])
- (
start[
0]
-
point[
0])
* (
end[
1]
-
start[
1])

 )


d
=
sqrt(

 (
end[
0]
-
start[
0])
*
*
2
+ (
end[
1]
-
start[
1])
*
*
2

 )


return
n
/
d


def
rdp(
points,
epsilon):


"""


 Reduces a series of points to a simplified version that loses detail, but


 maintains the general shape of the series.


 """


dmax
=
0.0


index
=
0


for
i
in
range(
1,
len(
points)
-
1):


d
=
point_line_distance(
points[
i],
points[
0],
points[
-
1])


if
d
>
dmax:


index
=
i


dmax
=
d


if
dmax
>=
epsilon:


results
=
rdp(
points[:
index
+
1],
epsilon)[:
-
1]
+
rdp(
points[
index:],
epsilon)


else:


results
= [
points[
0],
points[
-
1]]


return
results


def
generateGraph(
in_fname):


PADDING
=
30


threshold
=
1


out_fname
=
'graph_gt.pickle'


im_proj,
im_geotrans,
im_width,
im_height,
im_data
=
gdalTools.
read_img(
in_fname)


im
=
im_data


im
=
numpy.
array(
im)


if
len(
im.
shape)
==
3:


print(
'warning: bad shape {}, using first channel only'.
format(
im.
shape))


im
=
im[:, :,
0]


im
=
numpy.
swapaxes(
im,
0,
1)


im
= (
im
>=
threshold)


Image.
fromarray(
im.
astype(
'uint8')
*
60).
save(
"tmp0.png")


im
=
skimage.
morphology.
thin(
im)


im
=
im.
astype(
'uint8')


Image.
fromarray(
im
*
255).
save(
"tmp.png")


# extract a graph by placing vertices every THRESHOLD pixels, and at all intersections


vertices
= []


edges
=
set()


def
add_edge(
src,
dst):


if (
src,
dst)
in
edges
or (
dst,
src)
in
edges:


return


elif
src
==
dst:


return


edges.
add((
src,
dst))


point_to_neighbors
= {}


q
= []


while
True:


if
len(
q)
>
0:


lastid,
i,
j
=
q.
pop()


path
= [
vertices[
lastid], (
i,
j)]


if
im[
i,
j]
==
0:


continue


point_to_neighbors[(
i,
j)].
remove(
lastid)


if
len(
point_to_neighbors[(
i,
j)])
==
0:


del
point_to_neighbors[(
i,
j)]


else:


w
=
numpy.
where(
im
>
0)


if
len(
w[
0])
==
0:


break


i,
j
=
w[
0][
0],
w[
1][
0]


lastid
=
len(
vertices)


vertices.
append((
i,
j))


path
= [(
i,
j)]


while
True:


im[
i,
j]
=
0


neighbors
= []


for
oi
in [
-
1,
0,
1]:


for
oj
in [
-
1,
0,
1]:


ni
=
i
+
oi


nj
=
j
+
oj


if
ni
>=
0
and
ni
<
im.
shape[
0]
and
nj
>=
0
and
nj
<
im.
shape[
1]
and
im[
ni,
nj]
>
0:


neighbors.
append((
ni,
nj))


if
len(
neighbors)
==
1
and (
i,
j)
not
in
point_to_neighbors:


ni,
nj
=
neighbors[
0]


path.
append((
ni,
nj))


i,
j
=
ni,
nj


else:


if
len(
path)
>
1:


path
=
rdp(
path,
2)


if
len(
path)
>
2:


for
point
in
path[
1:
-
1]:


curid
=
len(
vertices)


vertices.
append(
point)


add_edge(
lastid,
curid)


lastid
=
curid


neighbor_count
=
len(
neighbors)
+
len(
point_to_neighbors.
get((
i,
j), []))


if
neighbor_count
==
0
or
neighbor_count
>=
2:


curid
=
len(
vertices)


vertices.
append(
path[
-
1])


add_edge(
lastid,
curid)


lastid
=
curid


for
ni,
nj
in
neighbors:


if (
ni,
nj)
not
in
point_to_neighbors:


point_to_neighbors[(
ni,
nj)]
=
set()


point_to_neighbors[(
ni,
nj)].
add(
lastid)


q.
append((
lastid,
ni,
nj))


for
neighborid
in
point_to_neighbors.
get((
i,
j), []):


add_edge(
neighborid,
lastid)


break


neighbors
= {}


# print(vertices)


# with open(out_fname, 'w') as f:


# for vertex in vertices:


# f.write('{} {}\n'.format(vertex[0], vertex[1]))


# f.write('\n')


vertex
=
vertices


for
edge
in
edges:


nk1
= (
vertex[
edge[
0]][
1],
vertex[
edge[
0]][
0])


nk2
= (
vertex[
edge[
1]][
1],
vertex[
edge[
1]][
0])


if
nk1
!=
nk2:


if
nk1
in
neighbors:


if
nk2
in
neighbors[
nk1]:


pass


else:


neighbors[
nk1].
append(
nk2)


else:


neighbors[
nk1]
= [
nk2]


if
nk2
in
neighbors:


if
nk1
in
neighbors[
nk2]:


pass


else:


neighbors[
nk2].
append(
nk1)


else:


neighbors[
nk2]
= [
nk1]


# f.write('{} {}\n'.format(edge[0], edge[1]))


# f.write('{} {}\n'.format(edge[1], edge[0]))


# print(neighbors)


# pickle.dump(neighbors, open(out_fname, "wb"))


return
neighbors
raster2lineShp.py
import
gdalTools


import
numpy
as
np


from
skimage
import
morphology


import
cv2
as
cv


from
osgeo
import
gdalconst,
gdal,
ogr,
osr


import
os


from
image2graph
import
*


def
imagexy2geo(
dataset,
col,
row):


'''


 according to GDAL The six parameter model integrates the coordinates on the image map ( Line number ) Convert to projected coordinates or geographic coordinates ( Coordinate system conversion according to specific data )


 :param dataset: GDAL Geographic data


 :param row: Line number of pixels


 :param col: Column number of pixels


 :return: Line number (row, col) Corresponding projection coordinates or geographical coordinates (x, y)


 '''


trans
=
dataset.
GetGeoTransform()


px
=
trans[
0]
+
col
*
trans[
1]
+
row
*
trans[
2]


py
=
trans[
3]
+
col
*
trans[
4]
+
row
*
trans[
5]


return
px,
py


def
raster2LineShp(
img_path,
strVectorFile):


graph
=
generateGraph(
img_path)


dataset
=
gdal.
Open(
img_path)


gdal.
SetConfigOption(
"GDAL_FILENAME_IS_UTF8",
"NO")
# In order to support Chinese path


gdal.
SetConfigOption(
"SHAPE_ENCODING",
"CP936")
# In order to make the property sheet fields support Chinese


ogr.
RegisterAll()


strDriverName
=
"ESRI Shapefile"
# Create data , Here to create ESRI Of shp file


oDriver
=
ogr.
GetDriverByName(
strDriverName)


if
oDriver
==
None:


print(
"%s The driver is not available !\n",
strDriverName)


oDS
=
oDriver.
CreateDataSource(
strVectorFile)
# create data source


if
oDS
==
None:


print(
" create a file 【%s】 Failure !",
strVectorFile)


# srs = osr.SpatialReference() # Create a spatial reference


# srs.ImportFromEPSG(4326) # Define a geographic coordinate system WGS1984


srs
=
osr.
SpatialReference(


wkt
=
dataset.
GetProjection())
# I added the output when reading the grid dataset, You don't have to specify projection here , Fully automatic , The above two lines can be annotated , And that proj Parameters can also be removed , Get rid of it yourself


papszLCO
= []


# Create Layer , Create a polygon layer ,"TestPolygon"-> Property sheet name


oLayer
=
oDS.
CreateLayer(
"TestPolygon",
srs,
ogr.
wkbMultiLineString,
papszLCO)


if
oLayer
==
None:


print(
" Layer creation failed !\n")


oDefn
=
oLayer.
GetLayerDefn()
# Define elements


oFeatureTriangle
=
ogr.
Feature(
oDefn)


# Create a single face


for
n,
v
in
graph.
items():


# if cls > len(cls_dict) - 1:


# continue


for
nei
in
v:


line
=
ogr.
Geometry(
ogr.
wkbLinearRing)
# Build geometry types : Line


nx,
ny
=
n[
1],
n[
0]


nx,
ny
=
imagexy2geo(
dataset,
nx,
ny)


line.
AddPoint(
nx,
ny)
# Add some 01


neix,
neiy
=
nei[
1],
nei[
0]


neix,
neiy
=
imagexy2geo(
dataset,
neix,
neiy)


line.
AddPoint(
neix,
neiy)
# Add some 02


# yard = ogr.Geometry(ogr.wkbLineString) # Build geometry types : polygon


# yard.AddGeometry(line)


# yard.CloseRings()


# geomTriangle = ogr.CreateGeometryFromWkt(str(line)) # Add the closed polygon set to the property sheet


oFeatureTriangle.
SetGeometry(
line)


oLayer.
CreateFeature(
oFeatureTriangle)


oDS.
Destroy()


if
__name__
==
'__main__':


rasterPath
=
'./temp/skeleton.tif'


shpPath
=
'./temp/skeleton.shp'


raster2LineShp(
rasterPath,
shpPath)
