Reference link :https://developer.aliyun.com/article/976083?spm=a2c6h.12873581.group.dArticle976083.3a8057c73DINVs
What we're going to introduce today , be called PyScript, Use it , You don't need to install any software . Just have a notepad , Can write a paragraph HTML+Python Code for . After writing , Double click this HTML file , Open with a browser , You can see it directly Python The running result of the code .
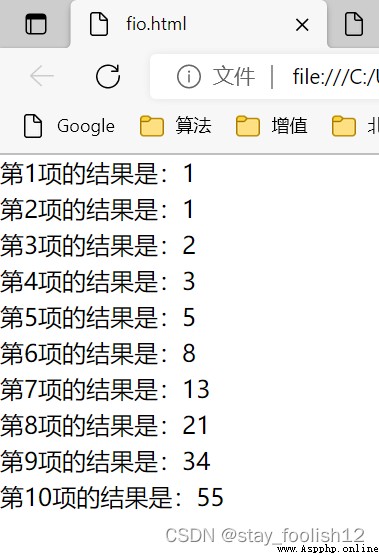
Suppose I'm going to write a piece of code now , Use an efficient algorithm to calculate the front of Fibonacci sequence 10 Item value . Now I've written the code , Want to verify that it is correct :
def fib(n):
if n in [1, 2]:
return 1
a = 1
b = 1
for _ in range(2, n):
a, b = b, a + b
return b
There is no on my computer Python, I don't know any online Python Interpreter . What shall I do? ? This is the time , You just need to be in this Python Add some more before and after the code HTML Code , Save it as a .html Just file it :
<html>
<head>
<link rel="stylesheet" href="https://pyscript.net/alpha/pyscript.css" />
<script defer src="https://pyscript.net/alpha/pyscript.js"></script>
</head>
<body>
<py-script>
def fib(n):
if n in [1, 2]:
return 1
a = 1
b = 1
for _ in range(2, n):
a, b = b, a + b
return b
for i in range(1, 11):
print(f' The first {i} The result of the item is :{fib(i)}')
</py-script>
</body>
</html>

up to now , Seems to be with those online Python The operating environment makes no difference . but PyScript Even worse , It comes with some common third-party libraries , for example numpy perhaps Matplot, It can even manually install third-party libraries .
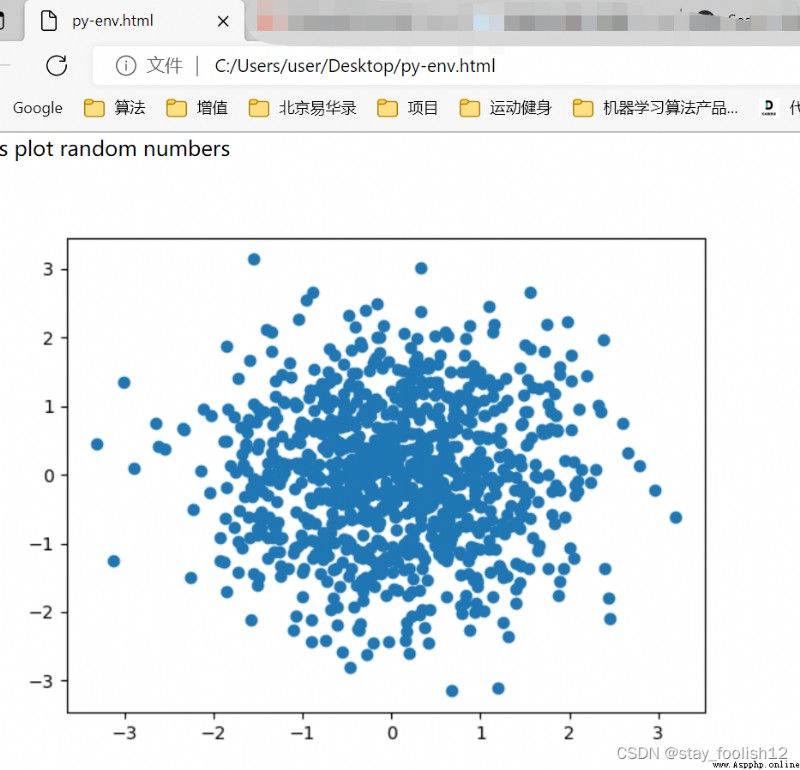
For what it comes with numpy and matplotlib, Label declaration can be used directly :
<html>
<head>
<link rel="stylesheet" href="https://pyscript.net/alpha/pyscript.css" />
<script defer src="https://pyscript.net/alpha/pyscript.js"></script>
<py-env>
- numpy
- matplotlib
</py-env>
</head>
<body>
<h1>Let's plot random numbers</h1>
<div id="plot"></div>
<py-script output="plot">
import matplotlib.pyplot as plt
import numpy as np
x = np.random.randn(1000)
y = np.random.randn(1000)
fig, ax = plt.subplots()
ax.scatter(x, y)
fig
</py-script>
</body>
</html>
