Catalog
Hello everyone I am Zhengyin
Demand analysis
Solution steps
final result
Technical summary
Today I'll teach you how to use Python- Simple implementation Excel Statistical function
It's not easy to make Click a free attention Support bloggers

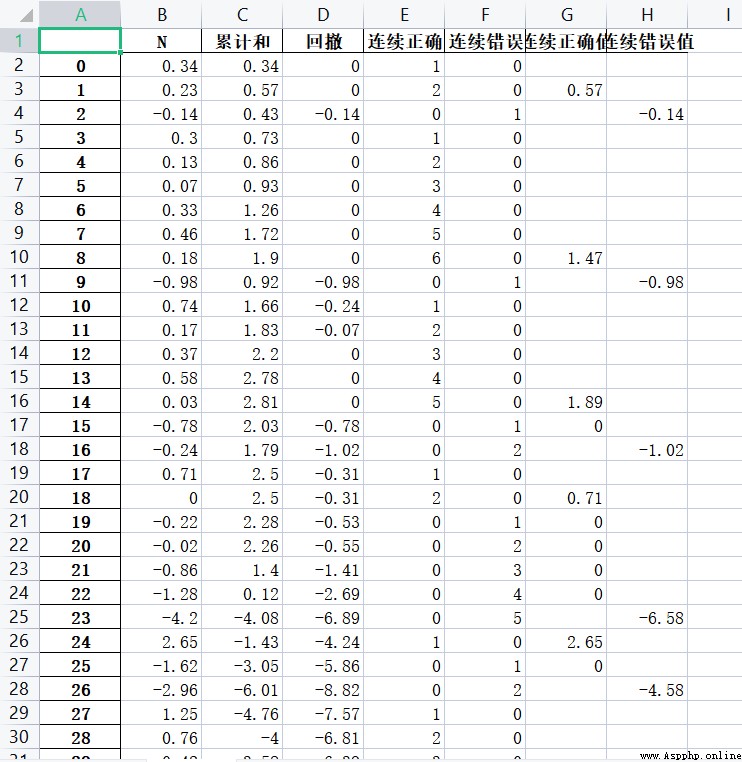
According to the original data , Calculate the cumulative sum 、 retracement 、 Continuous correct 、 Continuous errors 、 Continuous correct value and continuous error value 6 Data , Where the original data is greater than or equal to 0 Deemed to be correct , Raw data is less than 0 For a mistake . Understand the requirements , Let's start coding ~
import pandas as pd
# Create a function to calculate data
def calculate(df):
  pass
# Read raw data , Remove the index column
df = pd.read_excel(' demand 0621.xlsx',index_col=0)
# Call the function that calculates the data
calculate(df)
First write down the overall idea , Then try to figure out how to calculate each item of data
# Calculate the cumulative sum
    lst1 = []
    sum = 0
    for i in range(df.shape[0]):
        if i == 0:
            lst1.append(df['N'][i])
            sum += df['N'][i]
        else:
            sum += df['N'][i]
            lst1.append(sum)
    df[' Cumulative sum '] = lst1
# Calculate pullback
    lst2 = []
    max = 0
    for i in range(df.shape[0]):
        if i == 0:
            lst2.append(0)
        elif df[' Cumulative sum '][i] > max:
            max = df[' Cumulative sum '][i]
            lst2.append(0)
        elif df[' Cumulative sum '][i] < max:
            lst2.append(df[' Cumulative sum '][i]-max)
        elif df[' Cumulative sum '][i] == max:
            lst2.append(0)
    df[' retracement '] = lst2
# Calculate the number of consecutive correct numbers
    lst3 = []
    correct = 0
    for i in range(df.shape[0]):
        if df['N'][i] >= 0:
            correct += 1
            lst3.append(correct)
        else:
            lst3.append(0)
            correct = 0
    df[' Continuous correct '] = lst3
# Count the number of consecutive errors
    lst4 = []
    mistake = 0
    for i in range(df.shape[0]):
        if df['N'][i] < 0:
            mistake += 1
            lst4.append(mistake)
        else:
            lst4.append(0)
            mistake = 0
    df[' Continuous errors '] = lst4
# Calculate the continuous correct value
    lst5 = []
    for i in range(df.shape[0]):
        lst5.append('')
    right = 0
    for i in range(df.shape[0]):
        if df[' Continuous correct '][i] != 0:
            right += df['N'][i]
        elif df[' Continuous correct '][i] == 0 and right != 0:
            lst5[i-1] = right
            right = 0
    df[' Continuous correct value '] = lst5
# Calculate the continuous error value
    lst6 = []
    for i in range(df.shape[0]):
        lst6.append('')
    wrong = 0
    for i in range(df.shape[0]):
        if df[' Continuous errors '][i] != 0:
            wrong += df['N'][i]
        elif df[' Continuous errors '][i] == 0 and wrong != 0:
            lst6[i-1] = wrong
            wrong = 0
    df[' Continuous error value '] = lst6
The final will be dataframe Save to excel
    df.to_excel(' Complete the calculation .xlsx')
    print(' Keep success ')
Although the requirements have been completed, all the data have been calculated , But the calculation steps in the process of writing code are based on python Basic syntax implementation , about pandas Only through a lot of practice can we master the use of
I am a Zhengyin Looking forward to your attention