Preface
Get a two letter country code
Make a map of the world
Draw a complete world population map
Group countries according to their population
according to Pygal Set the style of the world map
PrefaceData sources :population_data.json,
Let's see what the data looks like
[ { "Country Name": "Arab World", "Country Code": "ARB", "Year": "1960", "Value": "96388069" }, { "Country Name": "Arab World", "Country Code": "ARB", "Year": "1961", "Value": "98882541.4" }, Omit ....]''' This file is actually a very long Python list , Each of these elements is a dictionary with four keys :
The name of the country 、 Country code 、 The year and the value representing the population .
We only care about every country 2010 The annual population , So we first write a program to print this information :'''
import json# Load data into a list filename= 'population_data.json'with open(filename) as f : pop_data = json.load(f)# Print each country 2010 The annual population for pop_dic in pop_data : if pop_dic["Year"] == '2010' : country_name= pop_dic['Country Name'] population =int(float(pop_dic['Value']) )#population_data.json Every key and value in is a string . To process these demographic data , We need to convert a string representing the number of people to a numeric value , For this we use the function int(): print(country_name + ":" + str(population))rab World:357868000Caribbean small states:6880000East Asia & Pacific (all income levels):2201536674East Asia & Pacific (developing only):1961558757Euro area:331766000Europe & Central Asia (all income levels):890424544Europe & Central Asia (developing only):405204000 Get a two letter country code ''' Before making a map , The last problem with data needs to be solved .Pygal The mapping tool in requires that the data be in a specific format : The country code is used to indicate the country , And the number of people in numbers . When dealing with geopolitical data , Several standardized country code sets are often used .
population_data.json It contains a three letter country code , but Pygal Use a two letter country code . We need to find a way to get a two letter country code according to the country name .
Pygal The country code used is stored in the module i18n(internationalization Abbreviation ) in .
Dictionaries COUNTRIES The key and value contained are two letter country code and country name respectively .
To view these country codes , Slave module i18n Import this dictionary from , And print its keys and values :'''
from pygal_maps_world.i18n import COUNTRIESfor country_code in sorted(COUNTRIES.keys()): print(country_code, COUNTRIES[country_code])ad Andorraae United Arab Emiratesaf Afghanistanal AlbaniaTo get the country code , We're going to write a function , It's in COUNTRIES To find and return the country code .
We put this function in a country_codes In the module , So that it can be imported into the visualizer :
from pygal_maps_world.i18n import COUNTRIESdef get_country_code(country_name): # According to the designated country , return Pygal The two letter country code used for code,name in COUNTRIES.items(): if name == country_name : return code # If the specified country is not found , Just go back to None return None# Print each country 2010 The annual population for pop_dic in pop_data : if pop_dic["Year"] == '2010' : country_name= pop_dic['Country Name'] population =int(float(pop_dic['Value']) )#population_data.json Every key and value in is a string . To process these demographic data , We need to convert a string representing the number of people to a numeric value , For this we use the function int(): code = get_country_code(country_name) if code : print(code + ":" + str(population)) else: print('error - ' + ":" + str(population))error - :357868000error - :6880000error - :2201536674error - :1961558757error - :331766000There are two reasons why error messages are displayed . First , Not all populations correspond to countries , Some populations correspond to regions ( The Arab world ) And economic groups ( All income levels ).
secondly , Some statistics use different full country names ( Such as Yemen, Rep., instead of Yemen). At present , We will ignore the data that caused the error , Let's see what the map looks like based on the successfully recovered data .
Make a map of the worldimport pygal_maps_world.maps# Created a Worldmap example , And set the... Of the map title attribute wm = pygal_maps_world.maps.World()wm.title = 'North, Central, and South America'''' Method add(), It accepts a tag and a list , The latter includes the country code of the country we want to highlight . Every time you call add() Will choose a new color for the designated country , The color and the assigned label are displayed on the left side of the chart . We want to show the whole North America in the same color , So the first time you call add() when , Include... In the list passed to it 'ca'、'mx' and 'us', To highlight Canada at the same time 、 Mexico and the United States . Next , Do the same for central and South American countries .'''wm.add('North America', ['ca', 'mx', 'us'])wm.add('Central America', ['bz', 'cr', 'gt', 'hn', 'ni', 'pa', 'sv'])wm.add('South America', ['ar', 'bo', 'br', 'cl', 'co', 'ec', 'gf','gy', 'pe', 'py', 'sr', 'uy', 've'])''' Method render_to_file() Create a... That contains the chart .svg file , You can open it in the browser . The output is a picture highlighting North America in different colors 、 A map of central and South America '''wm.render_to_file('americas.svg')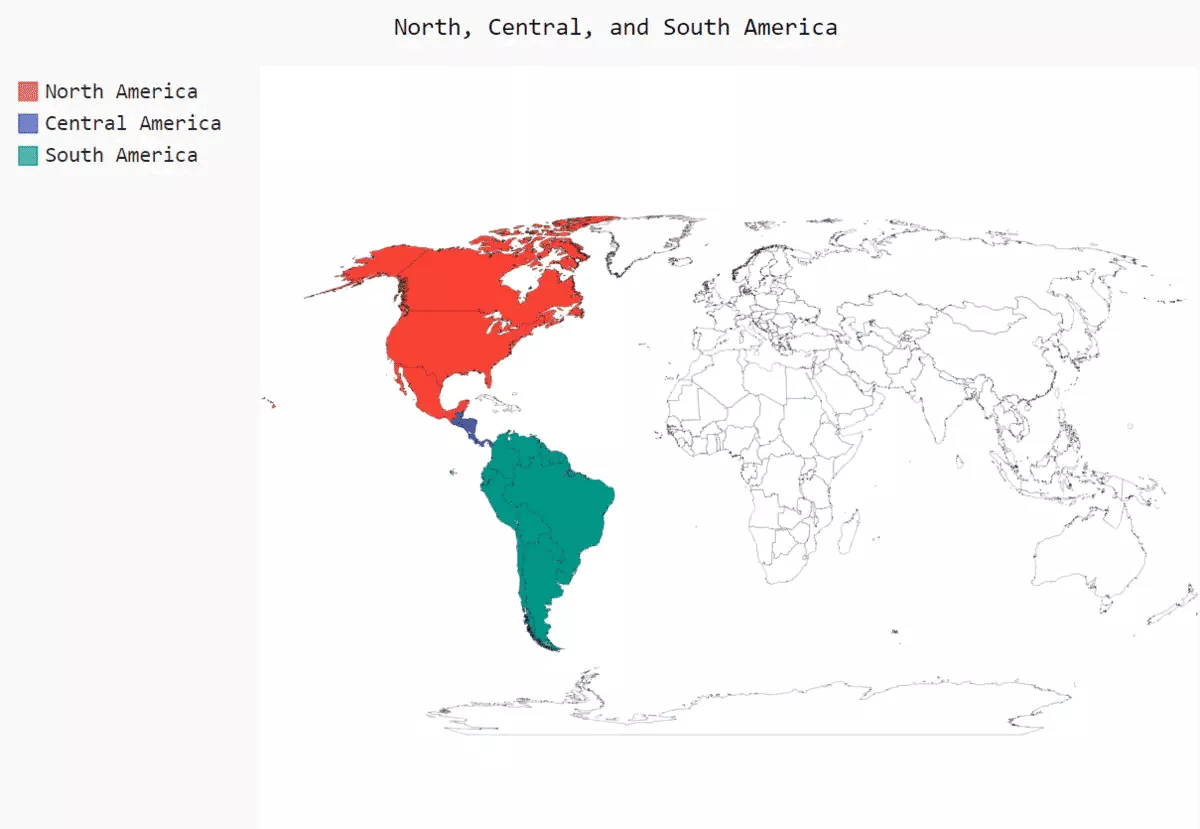
''' To show the population of other countries , You need to convert the previously processed data into Pygal Required dictionary format : The key is a two letter country code , The value is the number of people .
So , stay world_population.py Add the following code to :
import json
# Load data into a list filename= 'population_data.json'with open(filename) as f : pop_data = json.load(f)def get_country_code(country_name): # According to the designated country , return Pygal The two letter country code used for code,name in COUNTRIES.items(): if name == country_name : return code # If the specified country is not found , Just go back to None return None# Create a dictionary that contains the number of people cc_populations = {}# Print each country 2010 The annual population for pop_dic in pop_data : if pop_dic["Year"] == '2010' : country_name= pop_dic['Country Name'] population =int(float(pop_dic['Value']) )#population_data.json Every key and value in is a string . To process these demographic data , We need to convert a string representing the number of people to a numeric value , For this we use the function int(): code = get_country_code(country_name) if code : cc_populations[code] = populationimport pygal_maps_world.maps# Created a Worldmap example , And set the... Of the map title attribute wm = pygal_maps_world.maps.World()wm.title = 'world population in 2010, by country'wm.add('2010', cc_populations)wm.render_to_file('world_population.svg')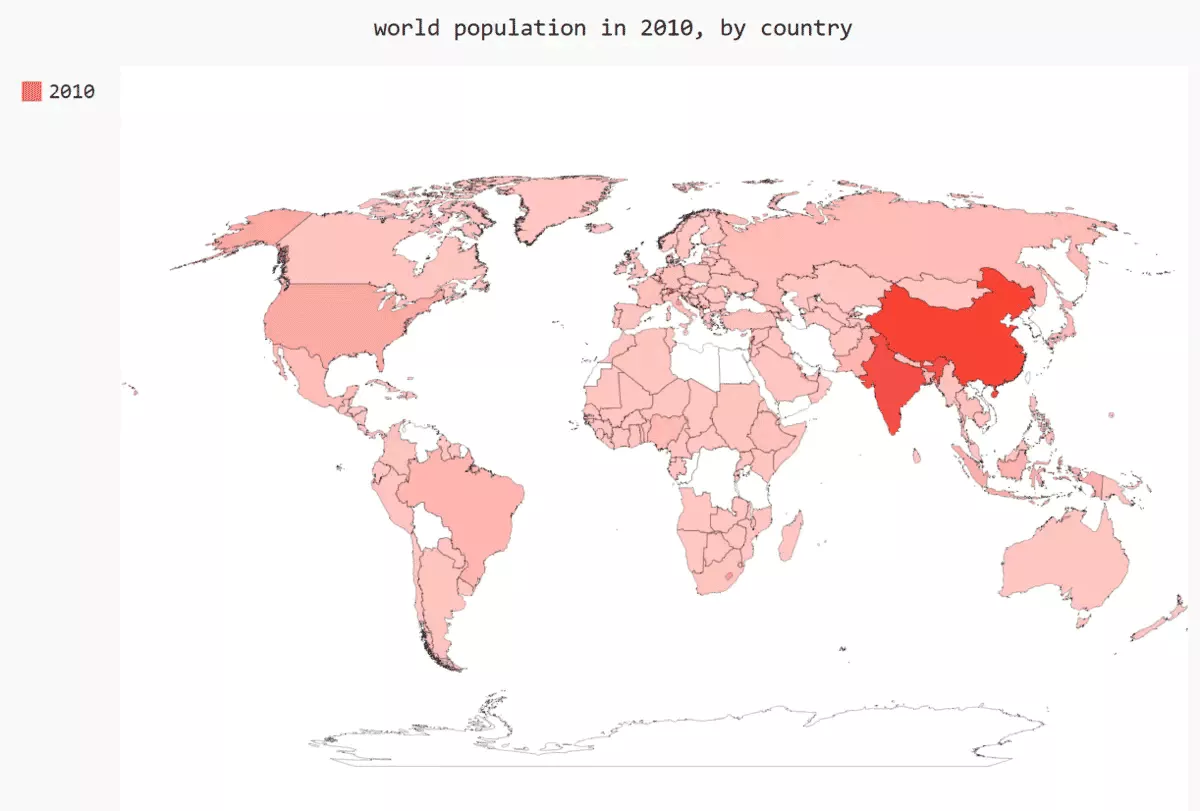
import json# Load data into a list filename= 'population_data.json'with open(filename) as f : pop_data = json.load(f)def get_country_code(country_name): # According to the designated country , return Pygal The two letter country code used for code,name in COUNTRIES.items(): if name == country_name : return code # If the specified country is not found , Just go back to None return None# Create a dictionary that contains the number of people cc_populations = {}# Print each country 2010 The annual population for pop_dic in pop_data : if pop_dic["Year"] == '2010' : country_name= pop_dic['Country Name'] population =int(float(pop_dic['Value']) )#population_data.json Every key and value in is a string . To process these demographic data , We need to convert a string representing the number of people to a numeric value , For this we use the function int(): code = get_country_code(country_name) if code : cc_populations[code] = population### Divide countries according to their population 3 Group cc_pop_1,cc_pop_2,cc_pop_3 = {},{},{}for cc,pop in cc_populations.items(): if pop < 10000000: cc_pop_1[cc] = pop elif pop < 1000000000: cc_pop_2[cc] = pop else: cc_pop_3[cc] = popimport pygal_maps_world.maps# Created a Worldmap example , And set the... Of the map title attribute wm = pygal_maps_world.maps.World()wm.title = 'world population in 2010, by country'wm.add('0-10m', cc_pop_1)wm.add('10m-1bn', cc_pop_2)wm.add('> 1bn', cc_pop_3)wm.render_to_file('world_population.svg')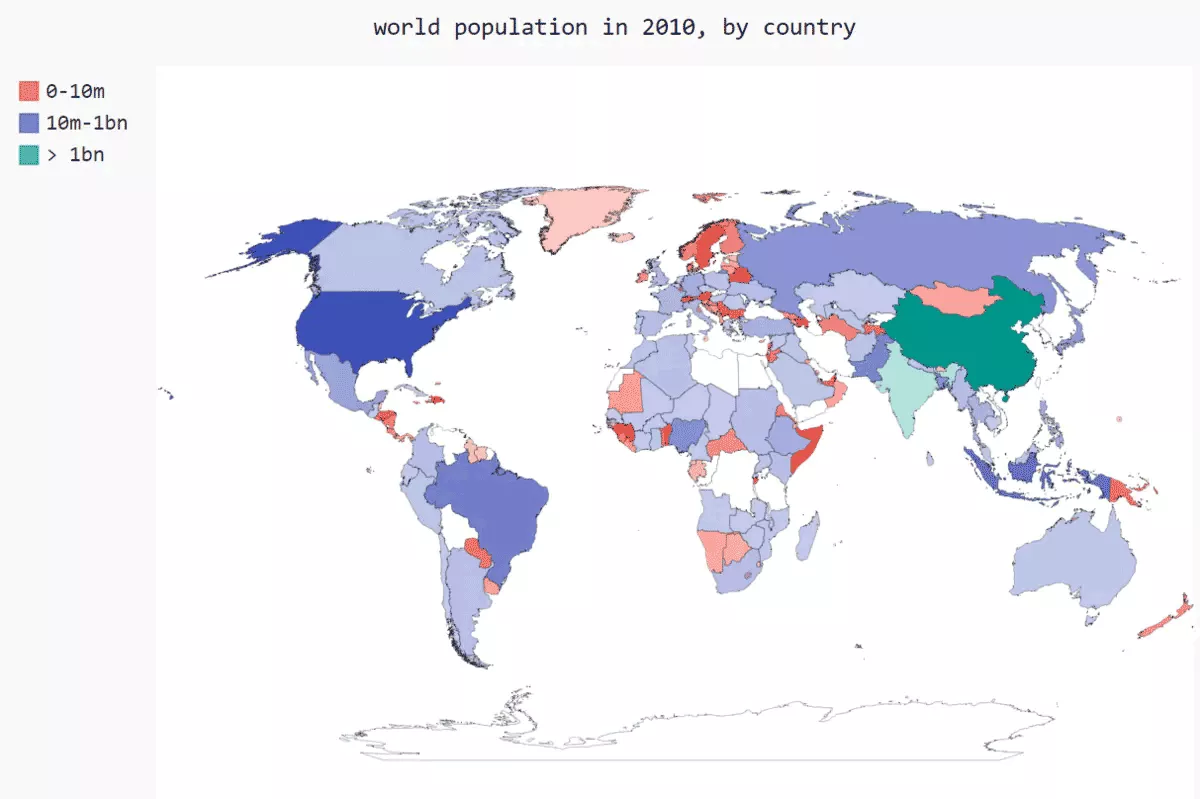
In this map , Grouping countries according to population is very effective though , But the default color settings are ugly . for example , ad locum ,Pygal Choose a bright pink and green base color .
Use Pygal Style setting instructions to adjust colors . We also let Pygal Use a primary color , But the base color will be specified , And make the color difference of the three groups greater
### according to Pygal Set the style of the world map ''' In this map , Grouping countries according to population is very effective though , But the default color settings are ugly . for example , ad locum ,Pygal Choose a bright pink and green base color . Use Pygal Style setting instructions to adjust colors . We also let Pygal Use a primary color , But the base color will be specified , And make the color difference of the three groups greater '''### Group countries according to their population import json# Load data into a list filename= 'population_data.json'with open(filename) as f : pop_data = json.load(f)def get_country_code(country_name): # According to the designated country , return Pygal The two letter country code used for code,name in COUNTRIES.items(): if name == country_name : return code # If the specified country is not found , Just go back to None return None# Create a dictionary that contains the number of people cc_populations = {}# Print each country 2010 The annual population for pop_dic in pop_data : if pop_dic["Year"] == '2010' : country_name= pop_dic['Country Name'] population =int(float(pop_dic['Value']) )#population_data.json Every key and value in is a string . To process these demographic data , We need to convert a string representing the number of people to a numeric value , For this we use the function int(): code = get_country_code(country_name) if code : cc_populations[code] = population### Divide countries according to their population 3 Group cc_pop_1,cc_pop_2,cc_pop_3 = {},{},{}for cc,pop in cc_populations.items(): if pop < 10000000: cc_pop_1[cc] = pop elif pop < 1000000000: cc_pop_2[cc] = pop else: cc_pop_3[cc] = popimport pygal_maps_world.maps# Created a Worldmap example , And set the... Of the map title attribute from pygal.style import RotateStylefrom pygal.style import LightColorizedStyle# Highlight color theme wm_style = RotateStyle('#336699', base_style= LightColorizedStyle)wm = pygal_maps_world.maps.World(style = wm_style)wm.title = 'world population in 2010, by country'wm.add('2010', cc_populations)wm.add('0-10m', cc_pop_1)wm.add('10m-1bn', cc_pop_2)wm.add('> 1bn', cc_pop_3)wm.render_to_file('world_population.svg')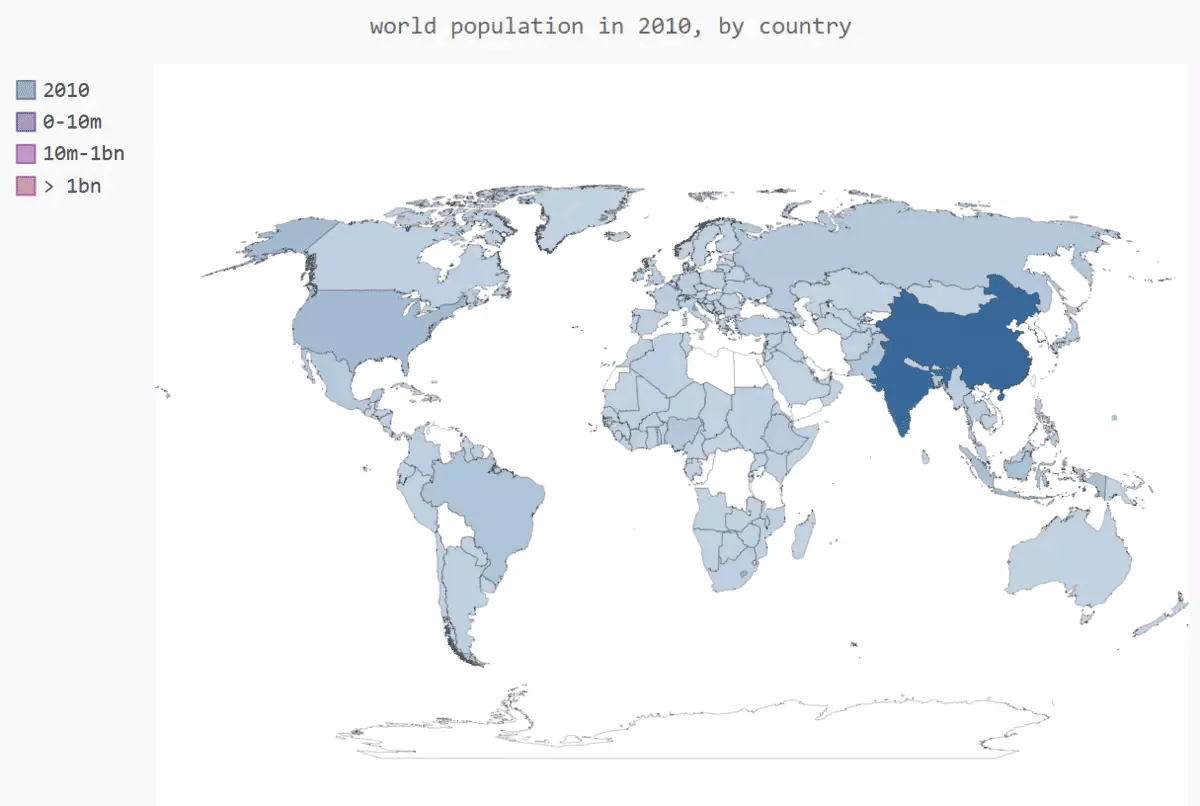
That's all python Data visualization drawing the details of the world population map , More about python For information on drawing the world population map, please pay attention to other relevant articles on Sdn !