The meaning of binarization : An image contains the target object 、 There's noise in the background , In order to extract the target object directly from the multi value digital image , The common way is to set a threshold T, use T Divide the image data into two parts : Greater than T The pixel group of and less than T The pixel group of . This is the most special way to study gray scale transformation , Called image Two valued (Binarization).
There are two commonly used threshold functions : Global threshold and Adaptive threshold
- cv2.threshold(src, thresh, maxval, type)
- cv2.adaptiveThreshold(src, maxValue, adaptiveMethod, thresholdType, blockSize, C, dst=None)
cv2.threshold(src, thresh, maxval, type)
Parameter meaning :
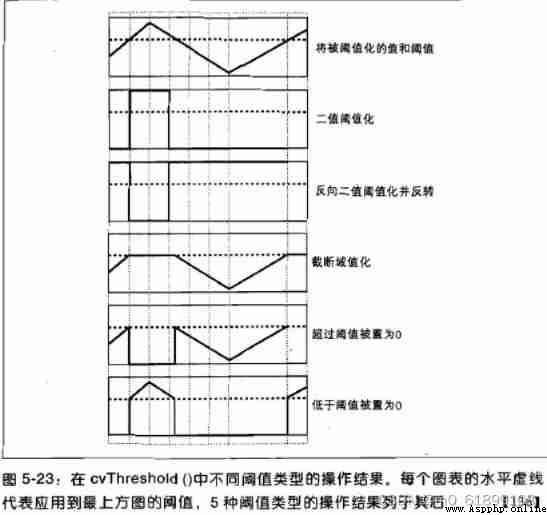
Threshold type table :
Set up 0
Functional expression :
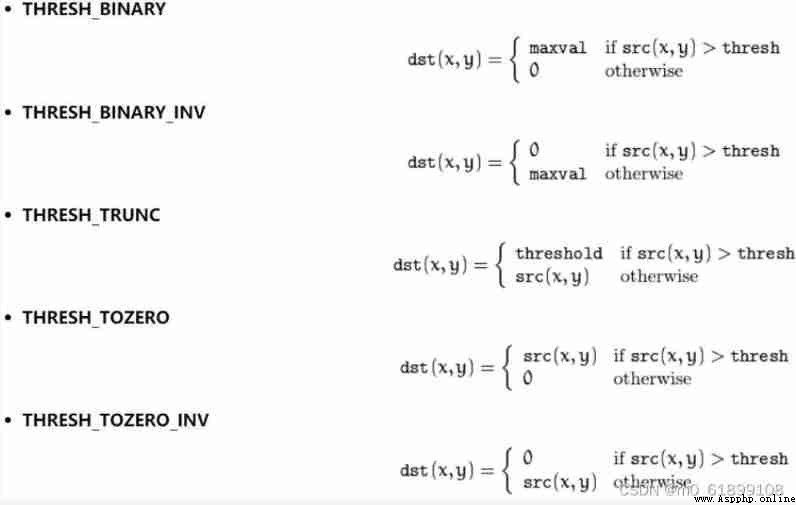
visualization :
import cv2
import numpy as np
from matplotlib import pyplot as plt
img=cv2.imread('123.jpg')
GrayImage=cv2.cvtColor(img,cv2.COLOR_BGR2GRAY)
ret,thresh1=cv2.threshold(GrayImage,127,255,cv2.THRESH_BINARY)
ret,thresh2=cv2.threshold(GrayImage,127,255,cv2.THRESH_BINARY_INV)
ret,thresh3=cv2.threshold(GrayImage,127,255,cv2.THRESH_TRUNC)
ret,thresh4=cv2.threshold(GrayImage,127,255,cv2.THRESH_TOZERO)
ret,thresh5=cv2.threshold(GrayImage,127,255,cv2.THRESH_TOZERO_INV)
titles = ['Gray Image','BINARY','BINARY_INV','TRUNC','TOZERO','TOZERO_INV']
images = [GrayImage, thresh1, thresh2, thresh3, thresh4, thresh5]
for i in xrange(6):
plt.subplot(2,3,i+1),plt.imshow(images[i],'gray')
plt.title(titles[i])
plt.xticks([]),plt.yticks([])
plt.show()
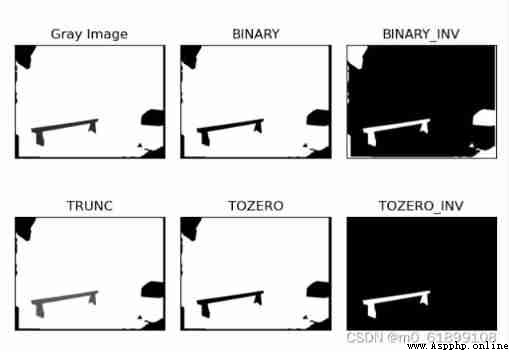
effect :
Code :
import cv2
img = cv2.imread("001.png")
print(img)
# First, perform grayscale processing , Then binary
Grayimg = cv2.cvtColor(img, cv2.COLOR_BGR2GRAY)
# 127 Is the binarization threshold , Greater than 255 All pixel values of are set to 0
ret, thresh = cv2.threshold(Grayimg, 127, 255, cv2.THRESH_TOZERO_INV)
cv2.imwrite('0001.png', thresh)
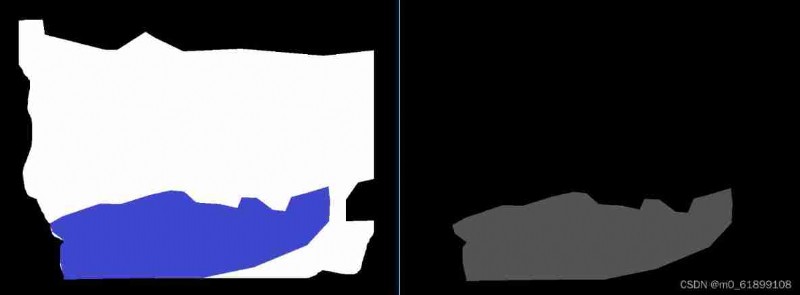
effect ( The picture on the left is the original , The figure on the right is a binary graph ) :
Code :
def binarization():
# Get all the picture names in the directory
filename = os.listdir(r"F:\python_Demo\DeepLearning\tools3\shapes\cmutestGT")
print(filename)
# os.listdir() Method to return a list of the names of the files or folders contained in the specified folder .
base_dir = r"F:\python_Demo\DeepLearning\tools3\shapes\CmutestGT" # input
new_dir = r"F:\python_Demo\DeepLearning\tools3\shapes\GT1" #output
for img in filename:
name = img
path1= os.path.join(base_dir,img)
img = cv2.imread(path1)
# print(img)
Grayimg = cv2.cvtColor(img, cv2.COLOR_BGR2GRAY)
ret, thresh = cv2.threshold(Grayimg, 250, 255,cv2.THRESH_TOZERO_INV)
cv2.imwrite('img.png', thresh)
image = Image.open('img.png')
# The image can be resized if necessary
#image = image.resize((350, 350),Image.ANTIALIAS)
path= os.path.join(new_dir,name)
image.save(path)
binarization()
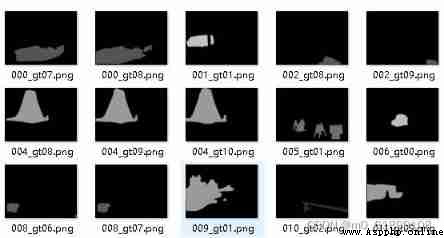
effect :
The global threshold only needs to specify a threshold value , The whole image is compared to this threshold .
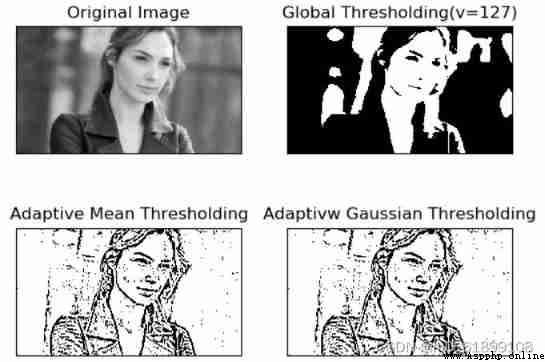
Adaptive threshold can be regarded as a local threshold , By specifying the size of an area , Compare this point with the average value of pixels in the area size ( Or other characteristics ) The size relationship determines whether the pixel belongs to black or white ( If it's a binary case ).
When different parts of the same image have different brightness , Adaptive threshold is adopted . At this time, the threshold value is calculated according to each small area on the image . Thus, better results can be obtained in the case of different brightness .
cv2.adaptiveThreshold(src, maxValue, adaptiveMethod, thresholdType, blockSize, C, dst=None)Parameter meaning :
adaptiveMethod:
thresholdType:
import cv2
import numpy as np
from matplotlib import pyplot as plt
img = cv2.imread('test.jpg', 0)
# median filtering
img = cv2.medianBlur(img, 5)
ret, th1 = cv2.threshold(img, 127, 255, cv2.THRESH_BINARY)
th2 = cv2.adaptiveThreshold(img, 255, cv2.ADAPTIVE_THRESH_GAUSSIAN_C, cv2.THRESH_BINARY, 11, 2)
th3 = cv2.adaptiveThreshold(img, 255, cv2.ADAPTIVE_THRESH_GAUSSIAN_C, cv2.THRESH_BINARY, 11, 2)
titles = ['Original Image', 'Global Thresholding(v=127)', 'Adaptive Mean Thresholding', 'Adaptivw Gaussian Thresholding']
images = [img, th1, th2, th3]
for i in range(4):
plt.subplot(2, 2, i+1), plt.imshow(images[i], 'gray')
plt.title(titles[i])
plt.xticks([]),plt.yticks([])
plt.show()
effect :
Batch image binarization python Code implementation
Opencv: Image binarization cv2.threshold()_ Accomplish sth. lasting by leading a quiet life * The blog of -CSDN Blog _cv2 Two valued
OpenCV-Python: For image binarization / Denoising cv2.threshold() Function details - Grey letter network ( Software development blog aggregation )
Image threshold _ Yes cv2.threshold,cv2.adaptiveThreshold etc. . - Mind, Ruogu - Blog Garden