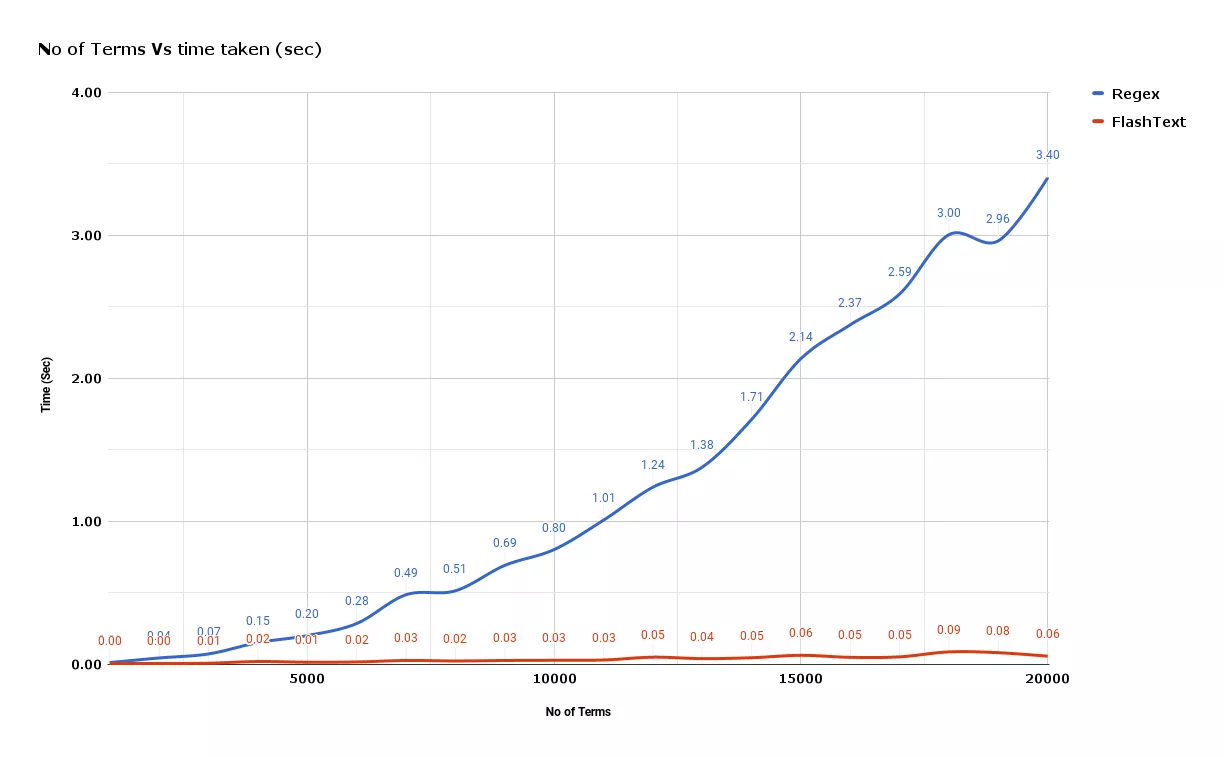
Blog posts : https://blog.manchan.ml/post/Drawing-mathematical-function-images-with-Python/ You can find me here
Recently I began to study mathematics , The function images of some topics are very characteristic , Some function images are difficult to draw by hand , So is there any way to make a standard and beautiful mathematical function image ?
The answer is a lot , There are many good software that can draw function images , however , I think of it. Python Data visualization .Python It's very hot in recent years , It is widely used in data analysis and in-depth learning , Its rich library makes it more powerful .
Here we use Python Of NumPy Libraries and Matplotlib Library for drawing .
NumPy(Numerical Python) yes Python An extended library of language , Support a large number of dimension arrays and matrix operations , In addition, it also provides a large number of mathematical function libraries for array operation .
Matplotlib yes Python Drawing library of . It can be connected with NumPy Use it together , Provides an effective MatLab Open source alternatives .
Want to use Python Source file , Just execute it in another source file import sentence , The grammar is as follows :
import module1[, module2[,... moduleN]
Python Of from Statement allows you to import a specified part from a module into the current namespace , The grammar is as follows :
from modname import name1[, name2[, ... nameN]]
numpy Use in package arange Function to create a numeric range and return ndarray object , The function format is as follows :
numpy.arange(start, stop, step, dtype)
according to start And stop Specified scope and step Set the step size , Generate a ndarray.
Parameter description :
start Starting value , The default is 0stop Termination value ( It doesn't contain )step step , The default is 1dtype return ndarray Data type of , If not provided , The type of input data will be used .numpy.linspace Function to create a one-dimensional array , An array is made up of a sequence of equal differences , The format is as follows :
np.linspace(start, stop, num=50, endpoint=True, retstep=False, dtype=None)
Parameter description :
start The starting value of the sequence stop The end value of the sequence , If endpoint by true, This value is contained in the sequence num Number of equal step samples to generate , The default is 50endpoint The value is true when , The sequence contains stop value , On the contrary, it does not include , The default is True.retstep If True when , The resulting array shows the spacing , On the contrary, it does not show .dtypendarray Data type of import numpy as np
from matplotlib import pyplot as plt
plt.rcParams['font.sans-serif'] = ['SimHei'] # Used to display Chinese labels normally
plt.rcParams['axes.unicode_minus'] = False # Used to display negative sign normally
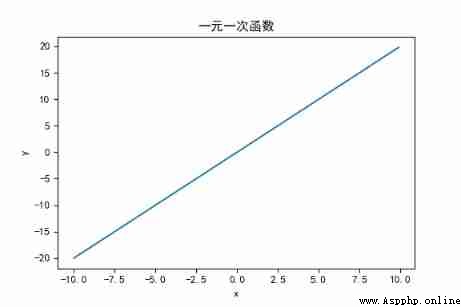
# Univariate linear function image
x = np.arange(-10, 10, 0.1)# Generate an isometric array
y = 2 * x
plt.xlabel('x')
plt.ylabel('y')
plt.title(" Univariate function ")
plt.plot(x, y)
plt.show()
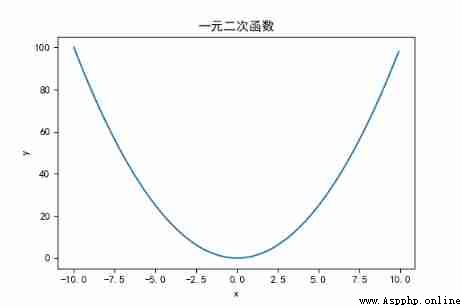
# Univariate quadratic function image
x = np.arange(-10, 10, 0.1)
y = x * x
plt.xlabel('x')
plt.ylabel('y')
plt.title(" Quadratic function of one variable ")
plt.plot(x, y)
plt.show()
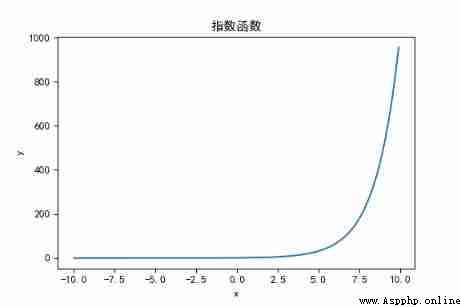
# Exponential function
x = np.arange(-10, 10, 0.1)
y = np.power(2, x)
plt.xlabel('x')
plt.ylabel('y')
plt.title(" Exponential function ")
plt.plot(x, y)
plt.show()
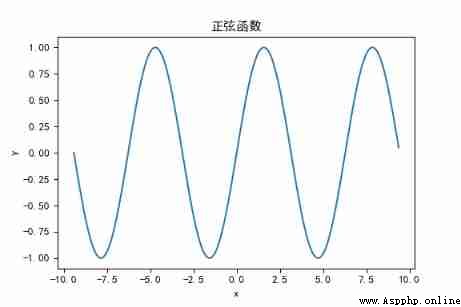
x = np.arange(-3 * np.pi, 3 * np.pi, 0.1)
y = np.sin(x)
plt.xlabel('x')
plt.ylabel('y')
plt.title(" Sine function ")
plt.plot(x, y)
plt.show()
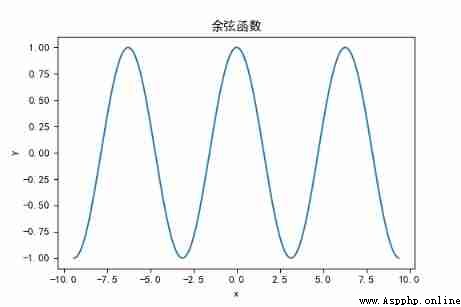
x = np.arange(-3 * np.pi, 3 * np.pi, 0.1)
y = np.cos(x)
plt.xlabel('x')
plt.ylabel('y')
plt.title(" cosine function ")
plt.plot(x, y)
plt.show()
from pylab import *
import numpy
figure(figsize=(12,8), dpi=72)
# Create a new 1 * 1 The children of , The next pattern is drawn in the second 1 block ( And the only piece )
subplot(1,1,1)
X = np.linspace(-np.pi*2, np.pi*2, 2048,endpoint=True)
C,S = np.cos(X), np.sin(X)
# Drawing cosine curves , Use blue 、 Successive 、 Width is 1 ( Pixels ) Lines of
plot(X, C,linewidth=1.5, line,label=" sine ")
# Draw a sine curve , Use green 、 Successive 、 Width is 1 ( Pixels ) Lines of
plot(X, S,linewidth=1.5, line,label=" cosine ")
legend(loc='upper left')
# Set the upper and lower limits of the horizontal axis
xlim(-4.5,4.5)
# Set horizontal axis mark
xticks([-np.pi, -np.pi/2, 0, np.pi/2, np.pi],
[r'$-\pi$', r'$-\pi/2$', r'$0$', r'$+\pi/2$', r'$+\pi$'])
yticks([-1, 0, +1],
[r'$-1$', r'$0$', r'$+1$'])
# Set the upper and lower limits of the vertical axis
ylim(-1.5,1.5)
# Set the vertical axis mark
yticks(np.linspace(-1,1,5,endpoint=True))
ax = gca()
ax.spines['right'].set_color('none')
ax.spines['top'].set_color('none')
ax.xaxis.set_ticks_position('bottom')
ax.spines['bottom'].set_position(('data',0))
ax.yaxis.set_ticks_position('left')
ax.spines['left'].set_position(('data',0))
# savefig("sincosin.png",dpi=72) # With 72dpi Save image
# Show... On the screen
show()
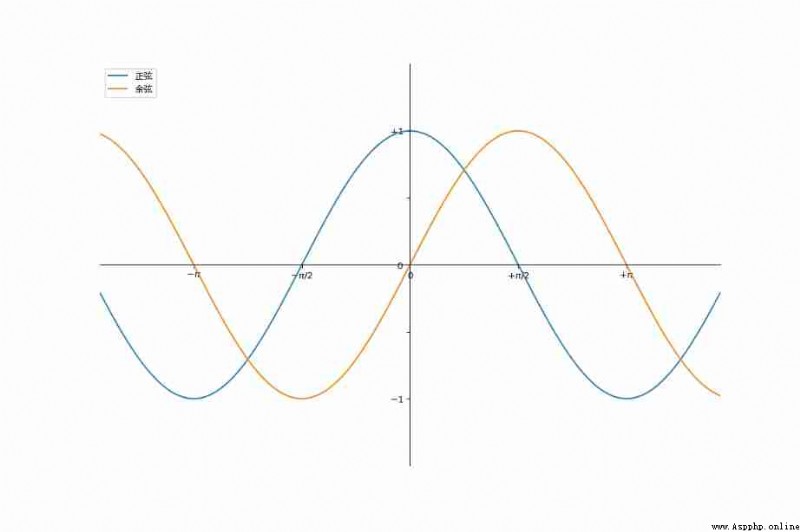
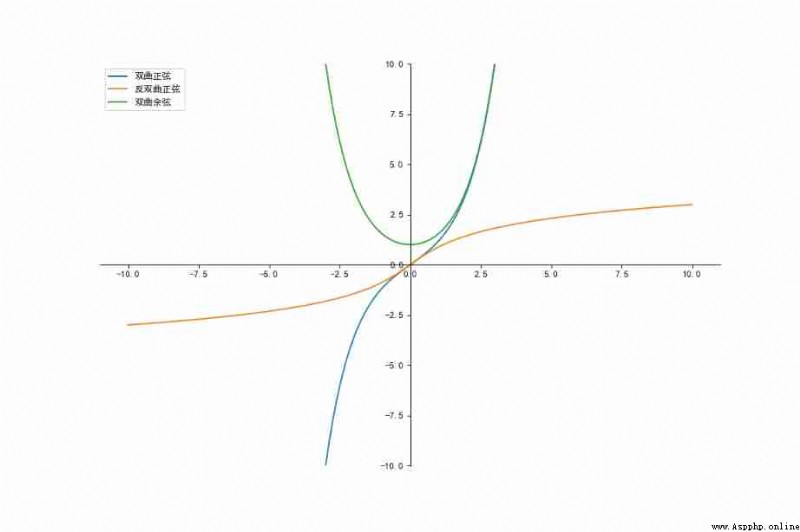
fig = plt.figure(figsize=(12,8), dpi=72)
x = np.arange(-10, 10, 0.01)
arsinh = np.log(x+np.sqrt(x**2+1))
sinh=0.5*(e**x-e**(-x))
cosh=0.5*(e**x+e**(-x))
plt.plot(x, sinh,label=" Hyperbolic sine ")
plt.plot(x, arsinh,label=" Anti hyperbolic sine ")
plt.plot(x, cosh,label=" Hyperbolic cosine ")
plt.legend(loc='upper left')
ylim(-10,10)
ax = gca()
ax.spines['right'].set_color('none')
ax.spines['top'].set_color('none')
ax.xaxis.set_ticks_position('bottom')
ax.spines['bottom'].set_position(('data',0))
ax.yaxis.set_ticks_position('left')
ax.spines['left'].set_position(('data',0))
plt.show()