A library commonly used by crawlers :requests,beautifulsoup,urllib2,scrapy etc. , Mainly used this time requests Library and regular expressions to extract key information .
Normal distribution has a very important property : Under certain conditions , The distribution of the sum of a large number of statistically independent random variables tends to be normal , This is the central limit theorem .
To verify the central limit law , Thinking of crawling to take Qipu population , Count the number of cities within each population range , Look at the histogram , As a result, I checked many websites and couldn't find the ready-made population , Finally, I saw the population of cities and prefectures given by provinces on the shopping website . But the population of each province needs to click in to view , And the population of Xinjiang has been reduced .
open F12, You can see the return content of the calling interface . use requests Call interface , Get the content and F12 The contents found in are consistent .
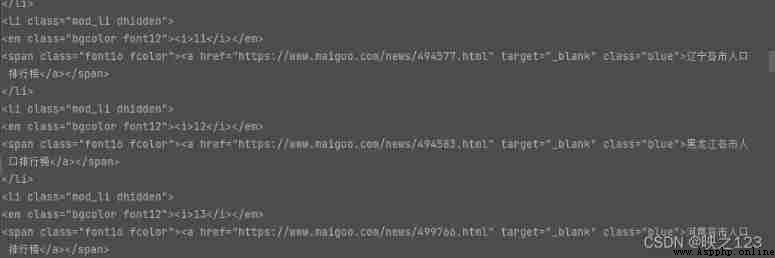
For example, click the population ranking list of Heilongjiang cities on the left , The page will open "https://www.maigoo.com/news/494583.html"

Click on the page one by one and count again , It will be the suppression of human nature , So here we use regular expressions to extract url And the corresponding provinces . Observe and find the province url The prefix for https://www.maigoo.com/news/ or https://www.maigoo.com/top/ Two kinds of , Besides Beijing , The corresponding province names all have province names + various , Use each to accurately match the name of the province . So in regular use | Match out url And provinces , Finally, the array list is generated , The array contains url And the name of the province .

The matching results are as follows :

Last use replace hold “ various ” Remove the word .
Use the crawler method to query the population data of each province, prefecture and city , Need to redirect the url, Then call again in turn url, get data .
Call the provinces in turn url, Extract the city name of each province and its corresponding population .
When extracting city names and population numbers , Call the content obtained by the interface for regular matching , Observe url It is found that the number of cities and population is url The position in is as follows :
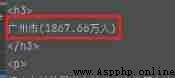
But not all of them , The contents are also stored as follows :
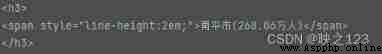
So regular matching , use .*? It can be matched to more <span> The content in , Without this part, the city name and population can be matched .
The matched city name and population are saved to city、count
Finally, save the extracted population as excel file . At the same time, query and add the population of Xinjiang .
The crawling population code is as follows :
import requests
import time,datetime
import pandas as pd
import random
import json,re
from fake_useragent import UserAgent
import openpyxl
items = [
{'http': 'http://171.35.171.247:9999'}
]
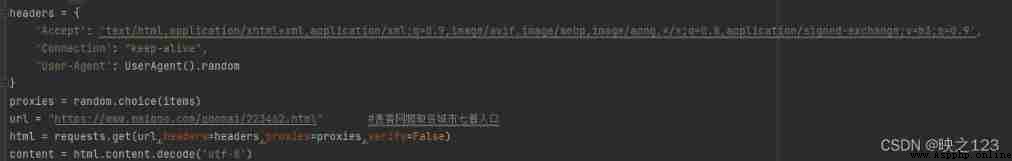
headers = {
'Accept': 'text/html,application/xhtml+xml,application/xml;q=0.9,image/avif,image/webp,image/apng,*/*;q=0.8,application/signed-exchange;v=b3;q=0.9',
'Connection': "keep-alive",
'User-Agent': UserAgent().random
}
proxies = random.choice(items)
url = "https://www.maigoo.com/goomai/223462.html" # Mack. Com crawls over the population of seven cities
html = requests.get(url,headers=headers,proxies=proxies,verify=False)
content = html.content.decode('utf-8')
title_city = re.findall(r'><a href="(https://www.maigoo.com/news/\d+.html|https://www.maigoo.com/top/\d+.html)" target="_blank" class="blue">(\w+ various | Beijing )\w+', content) # Regular matching
census = pd.DataFrame(columns=['city','provence','count']) # The city name , Province , population size
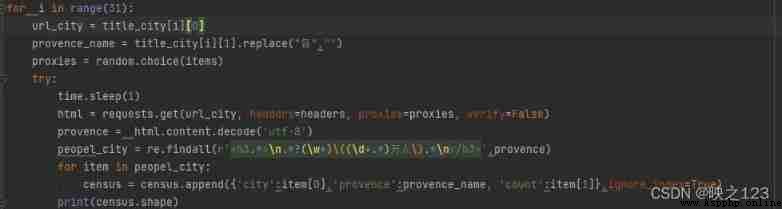
for i in range(31):
url_city = title_city[i][0]
provence_name = title_city[i][1].replace(" various ","")
proxies = random.choice(items)
try:
time.sleep(1)
html = requests.get(url_city, headers=headers, proxies=proxies, verify=False)
provence = html.content.decode('utf-8')
peopel_city = re.findall(r'<h3.*>\n.*?(\w+)\((\d+.*) ten thousand people \).*\n</h3>',provence)
for item in peopel_city:
census = census.append({'city':item[0],'provence':provence_name, 'count':item[1]},ignore_index=True)
print(census.shape)
except:
continue
census.to_excel(" The population of each city 2.xlsx",index=False)Last use pandas Of cut Methods count the number of cities in each interval according to the interval , For example, greater than 1600 Cities with a population of million have 6 seat .
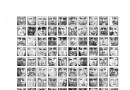
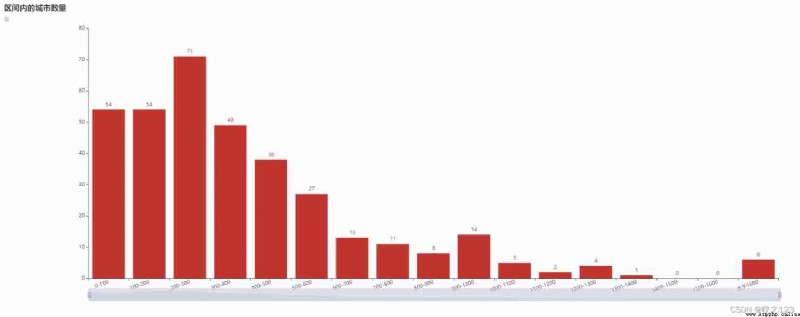
The histogram of time zone distribution without filtering is as follows :
Excluding municipalities , Merge several counties in Hainan , Then statistics . The histogram is as follows :
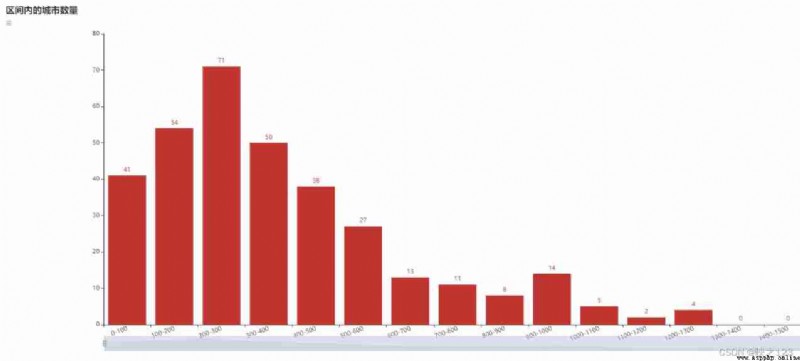
Observe the figure , It is found that the graph is somewhat like a Gaussian distribution .
import numpy
import pandas as pd
import matplotlib.pyplot as plt
from pyecharts.charts import Bar
from pyecharts import options as opts
data = pd.read_excel(" The population of each city 2.xlsx")
data = pd.DataFrame(data)
people_count = data['count'].values.tolist()
range_num = []
labes = []
j = 1
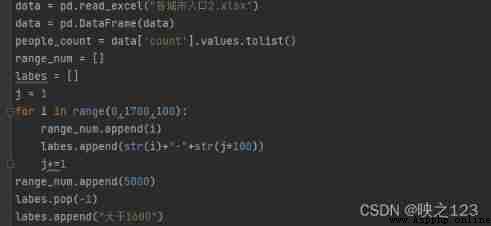
for i in range(0,1700,100):
range_num.append(i)
labes.append(str(i)+"-"+str(j*100))
j+=1
range_num.append(5000)
labes.pop(-1)
labes.append(" Greater than 1600")
print(range_num,labes)
cuts = pd.cut(people_count,range_num,labels=labes)
couts_range = cuts.value_counts().values.tolist()
bar = Bar(init_opts=opts.InitOpts(width="2000px",height="700px",page_title=" The number of cities in each section "))
bar.add_xaxis(labes)
bar.add_yaxis("", couts_range)
bar.set_global_opts(
xaxis_opts=opts.AxisOpts(axislabel_opts=opts.LabelOpts(rotate=20)),
title_opts=opts.TitleOpts(title=" The number of cities within the range ", subtitle=" sit "),
datazoom_opts=opts.DataZoomOpts(),
)
bar.render_notebook()
bar.render(' National population 2.html')